At the outset, we (Amit and I) want to make one thing clear that Garware Hi-tech is a “messy business” with questionable management practices. Two things that interested us in looking at the business were 1) new line of businesses; solar window film and PPF (added recently) crossing over legacy commodity business and 2) management’s sudden change in stance to openly share the business changes with the investor community through con-calls. So before rejecting this business primarily only due to promoter issues, we thought that this business was worthy enough to dive deeper to better understand the changing landscape and check what the risk:reward proposition was being offered by the market. With that being said, our main goal is to share our understanding of the business that we have had so far, and the scuttle-butt findings. And it is upto the reader to determine whether the risk:reward proposition is favorable or not after getting the complete view.
Disc: both are invested.
Background:
Garware Hi-Tech Films Ltd (GHFL) is engaged in manufacturing polyester films. The company belongs to the Garware family. The Garware group was founded by Dr. Bhalchandra Digamber Garware. Dr. BD Garware has four sons; Ramesh Garware (Garware Technical Fiber), Shashikant Garware (Garware Hi-Tech Film), Chandrakant Garware (Garware Synthetics), and Ashok Garware (Garware Marine Ind). All the four companies are listed but only Garware Technical and Garware Hi-Tech seem to be fully operational.
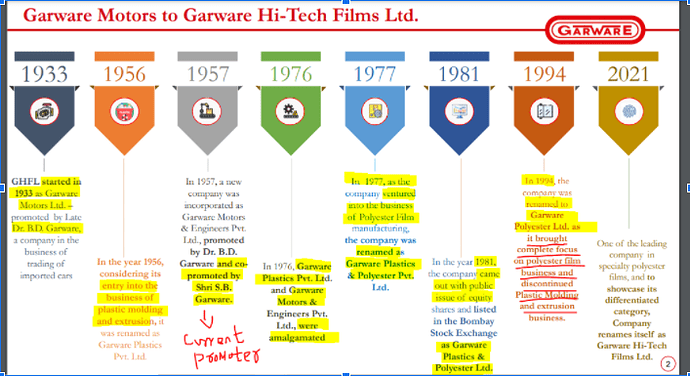
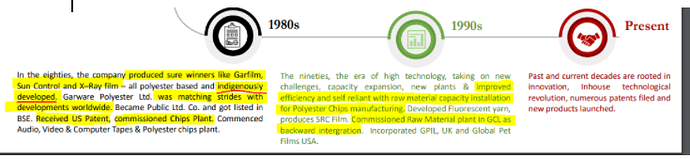
A brief history of the GHFL’s evolution-
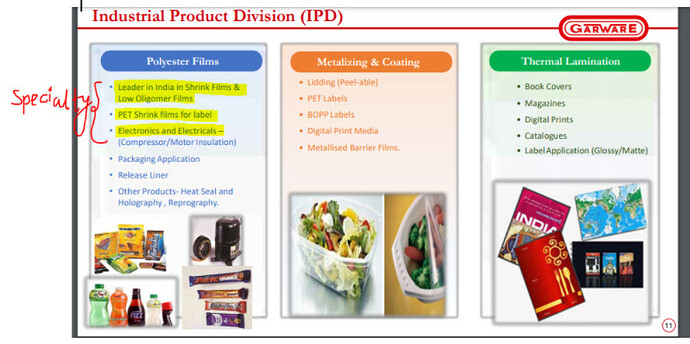
There are two broad divisions; Industrial and Consumer.
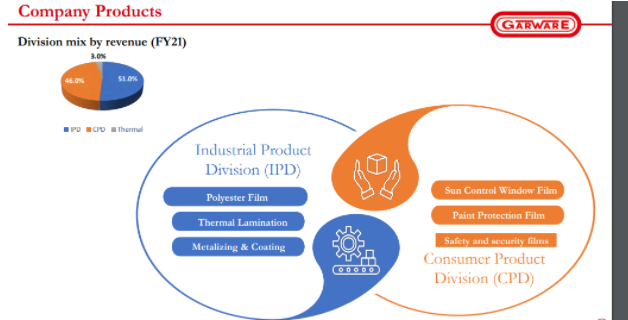
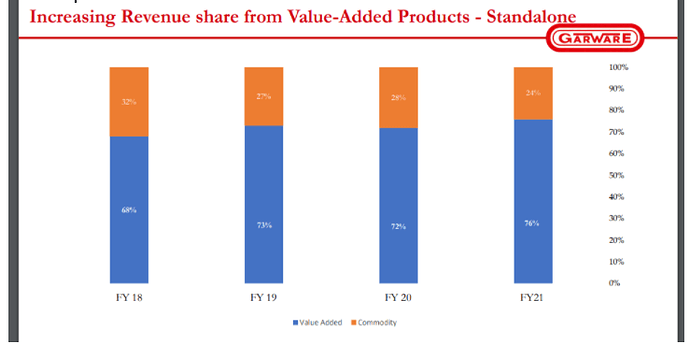
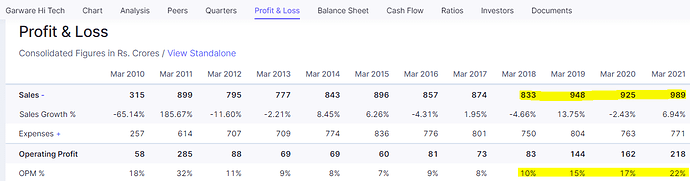
The company is shifting its focus on the value-added specialty business and has reduced the pie of the commodity business over the years-
Within the value-added business, one particular segment; Sun Control Films, is growing at a much faster rate-
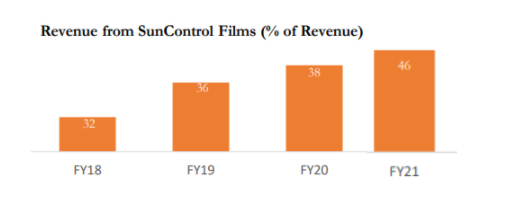
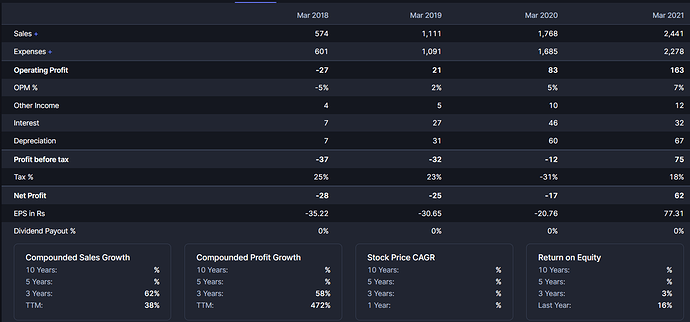
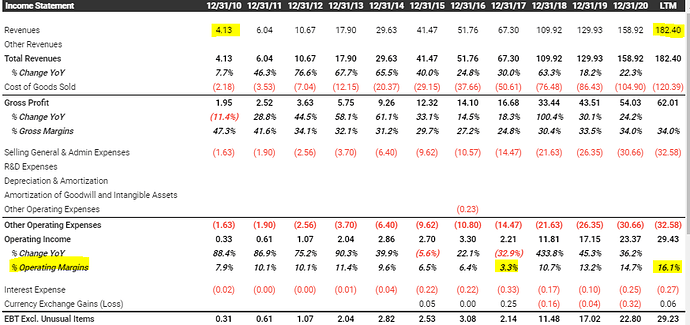
So, even though the overall topline did not grow by much during this period as the commodity business was de-growing, the margins expanded. The company claims that sun-control films is a very high margin business and hence the margin expansion.
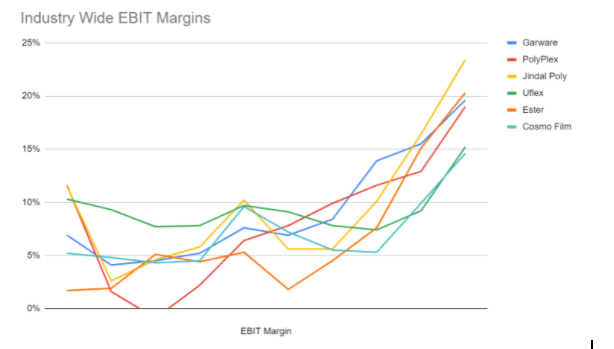
This growth in margins and sun-control business has coincided with an industry-wide upcycle and hence, it remains to be seen if GHFL trend is secular and not just a short-term phenomenon
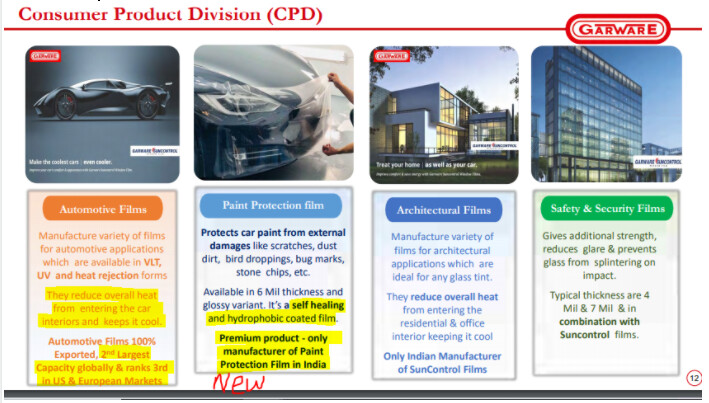
Sun Control Business- These are the window films that we once used (now banned in India) on our car windows to protect from excessive heat and direct sun rays.
-
Sun Control is a 450cr business for them (46% of FY21 revenues).
-
The company does private labeling and also has 3 brands; Global Window Films (Global), SunControl Films, and Garware.
-
The pie of branded business is not specified and the company does not disclose that but gives a broad range of over 60-70%.
-
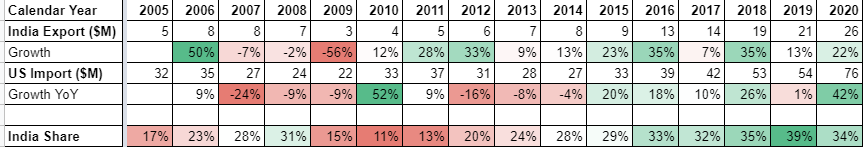
Their main brand is Global which is present in the US and European markets. Global has grown from a 30cr business in FY12 to 200cr in FY20 in the US. Source- Past annual reports
![image]()
-
USA contributed 20% to FY20 revenues and became 30% of overall business in FY21. This is a growth of 60% YoY.

Qualitative insights on the Sun Control Business-
-
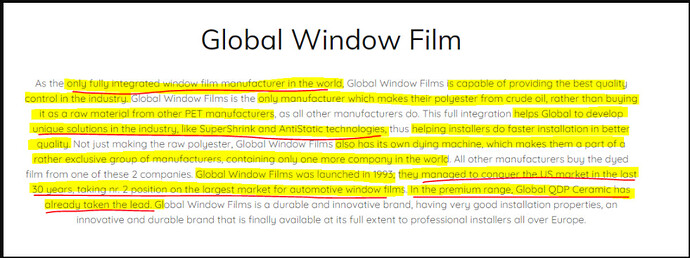
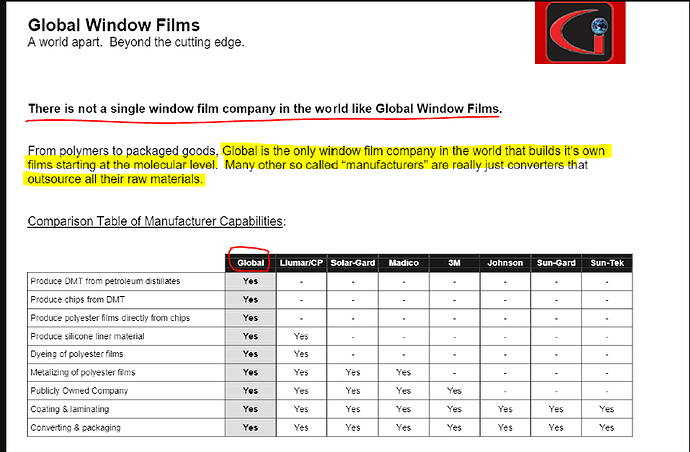
Garware calls itself a “high chemistry” company and claims to be the only company in the world with backward integration for manufacturing Solar control films. Extract from their website
![image]()
-
Extract from a User Manual-
![image]()
-
Third Largest Brand in the US- Garware claims that Global is the third largest brand in the US after 3M and Eastman. This was confirmed by a neutral industry expert who mentioned that Global is in the Tier-1 category along with 3M, Eastman, and Saint Gobain based on size, quality, and brand visibility.
- We don’t know how the branded sales have shaped up over the years. The company does not disclose that data.
-
Garware claims itself to be the only exporter manufacturer of Sun Control films in India.
-
There are not many “quality” sun-control manufacturers outside of the US which is Garware’s key market for this business. Even though the sun-control film is a $300-$400M business in the US, only $75M was imported in CY20. The rest is manufactured in the US.
Key Growth Drivers-
- The company did 115cr capex in FY20 & FY21. 50-60cr out of this was for a new product called Paint Protection Film (PPF). The rest was for modernisation of existing facilities and to make them fungible.
-
Paint Protection Film (PPF)- The company has invested 50-60cr and has installed a 300 lac sq ft capacity of PPF. The plant was commissioned in Dec’20.
- They expect a turnover of 300cr by FY23 end with more than 30% margins.
- Unlike Sun Control, they don’t plan to do any private label here.
-
Expansion in sun control/Consumer Division- The current sun control capacity is running at 100% utilisation. Garware recently announced a 135cr capex to increase the existing capacity of the Sun Control business by 75%. This will take the manufacturing capacity from 2400 lac sq. ft to 4200 lac sq. ft.
- They expect this capacity to be ready by end of FY22 and should contribute 300cr in 2 years time
- This capacity is fungible and can also be used to manufacture PPF.
- PPF + Sun Control, they want this business to be more than 1000cr in 3-4 years time which is right now at 450cr.
PPF & XPEL:
PPF is an ultra-thin transparent film that protects the car from minor scratches and protects the surface of the car. It has self healing properties; it can instantly heal if the top layer of the body’s paint is scratched. This is a premium product and is installed only by luxury car owners. More on PPF here.
PPF is not a new product, the film was developed by 3M for military use during the Vietnam War. Until 2011, PPF or Clear Bra as it was known, wasn’t widely popular among car owners. XPEL introduced a self-healing PPF in 2011 for luxury car owners.
XPEL is a $2B company and is the largest player in PPF in the US and globally. Window Film and PPF come in rolls. Installers of Window Film and PPF use software and a cutting machine to cut the roll according to the size of the car. XPEL was traditionally a software company. Their software, Design Access Program (DAP), is considered the best and is used by a lot of installers in the US. DAP has the largest database of window and car surface patterns in the world. Until 2010, XPEL was a software company. Their revenues ballooned from $10M in FY12 to $180M in FY21. ~70% of this is from PPF which was Zero 10 years ago.
XPEL is a classic branding and marketing company which has innovated and mastered the supply chain in this industry and has given the likes of 3M and Eastman a tough time in the PPF market. There are tons of resources on XPEL on the internet since this is one of the best performing US microcap companies in the last 10 years. Sharing a few if someone wants to go deeper-
- https://twitter.com/iddings_sean/status/1338645392217534466?s=20 4
- https://seekingalpha.com/article/2676825-xpel-technologies-wrapping-up-a-sticky-model-and-hyper-growth-worth-multiples-of-todays-price 3
- https://seekingalpha.com/article/1994221-xpel-technologies-an-undervalued-growth-machine-with-multi-bagger-potential 1
- Xpel Technologies Part 1: Company Overview – Travis Wiedower
- https://twitter.com/clueless_1337/status/1351306846762487808
Few extracts from XPEL’s presentations-
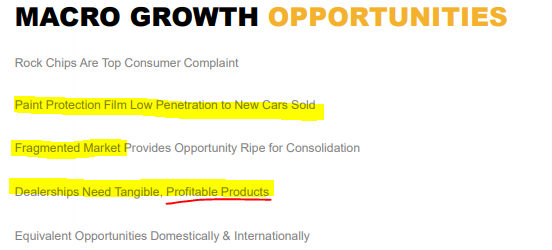
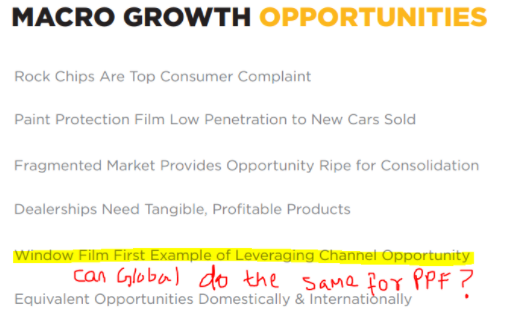
PPFs are installed by the same tinters who install window films. The supply chain is exactly the same and this increases the dealers/tinters’ offerings and profitability. Garware is confident of achieving 300cr sales from PPF in 2 years time and wants to capture 8-10% market share.
The industry insider confirmed that PPF is growing at double-digits and they think that it will continue to grow at the same rate for the next 5 years because of new car sales and low penetration.
Presence of China- There are three ways to manufacture PPF using- Thermoplastic Polyurethane (TPU), PVC, or a blend of PVC and TPU. Products that are only TPU based are of the highest quality and PVC is the lowest. China is mostly present in PVC and blended based PPF manufacturing, the market of which in the developed markets is very small.
14 posts - 5 participants