Quantcast
Channel: ValuePickr Forum - Top topics
Viewing all 602 articles
Browse latest View live

The Anup Engineering Ltd - Can it scale up?

$
0
0

@ankitgupta wrote:

About the company
The Anup Engineering Limited (Anup) was incorporated in 1962 and is part of the Arvind group of Ahmedabad. The company was demerged from Arvind Ltd and listed as a separate entity in March, 2019. The company is engaged in the business of design and fabrication of process equipment which mainly includes heat exchangers, pressure vessels, centrifuges, columns/towers and small reactors that find applications in refineries, petrochemicals, chemicals, pharmaceuticals, fertilizers and other allied industries. Heat exchangers contributed 80 – 90% of the sales while remaining was contributed through sales of pressure vessels, centrifuges, columns/towers and small reactors.

About the product
Heat exchangers are used to transfer heat or cooling from one liquid to another. Key industries served – oil & gas refineries, petrochemicals, fertilizers, chemicals, pharmaceuticals, food and other allied industries. The company has technical collaboration with Lummus Technology for special High Efficiency Heat Exchangers (Helixchanger).
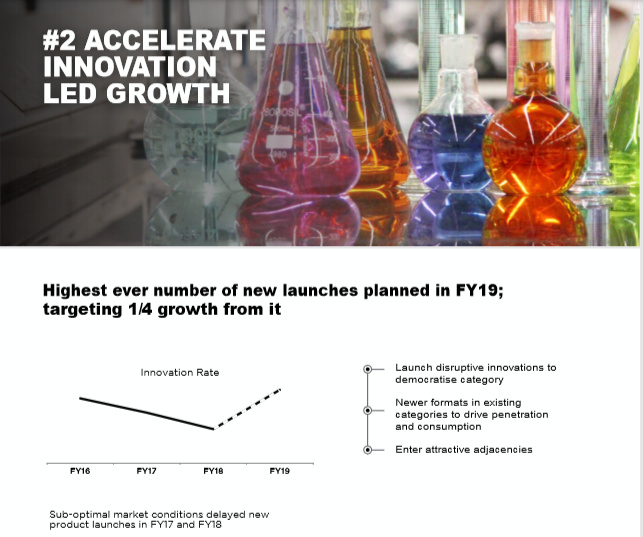

(source: Anup Presentation)

About the industry
Heat exchanger is a USD 21 billion industry globally – used to increase efficiencies. Largest players in the industry include: - Alfa Laval (>30% market share), Kelvion (Germany), Hisaka (Japan), SPX Flow/APV (US), SWEP (US). High profitability margins with many companies reporting gross margins of more than 45%. Alfa Laval has EBITDA margins of 14 – 15% while its Indian subsidiary also has EBITDA margins of 19%.
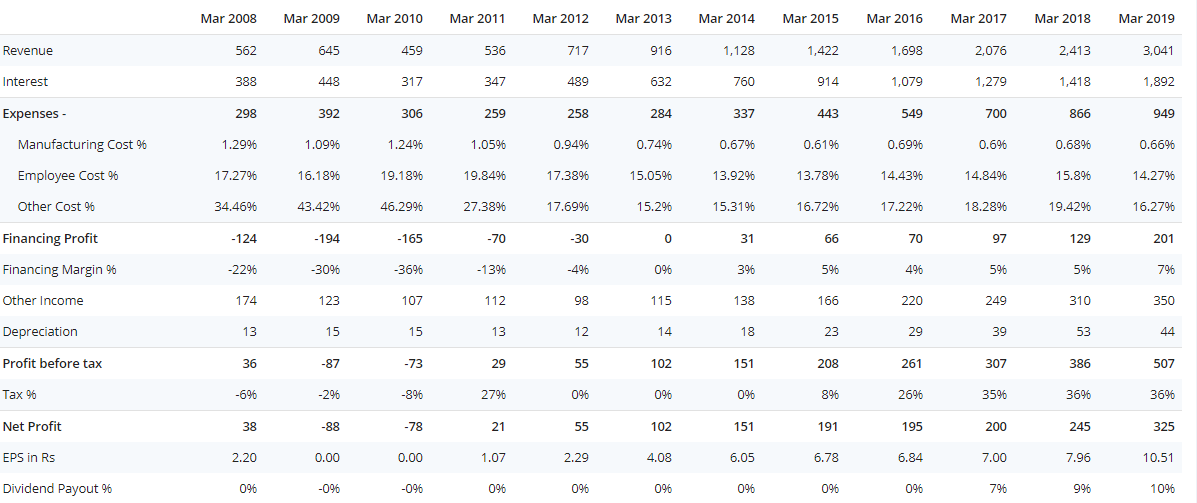
This is something which Credit Suisse prepared forx capital goods industry (was made for Alfa Laval):
image

Transformation Journey of the company
Despite being in the engineering segment since 1962, the company was not able to scale the business. However, the transformation of the company started when its current CEO – Mr. Rishi Roop Kapoor joined the company in 2010. Mr. Kapoor has pretty good reputation in the engineering industry and is an IIT Roorkee pass out. Prior to joining Anup, he was associated with Godrej and Boyce for more than a decade. The company has become a net cash company during the past few years and generates healthy cash flows.
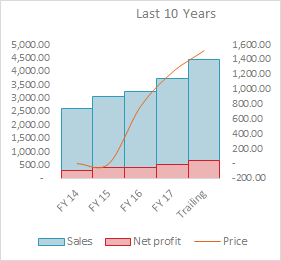
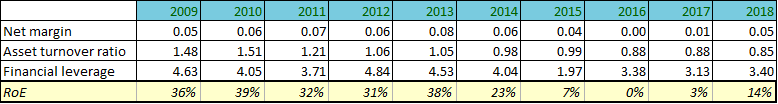
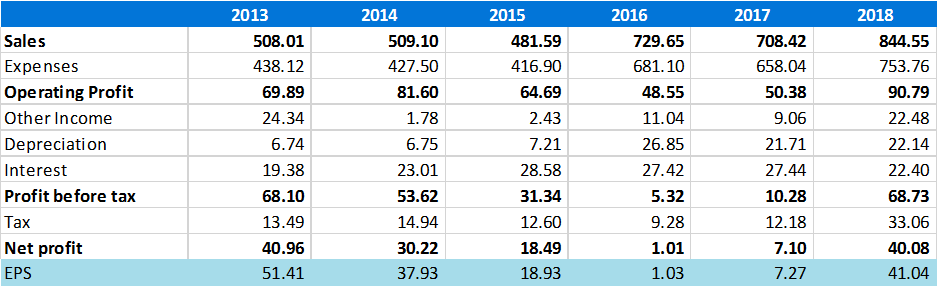
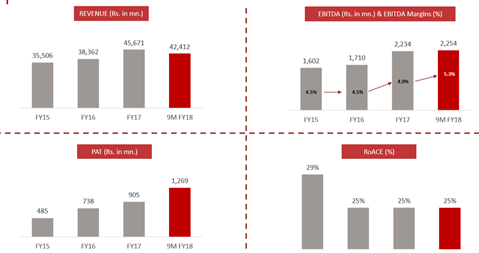
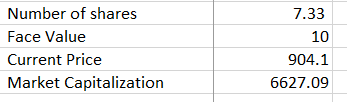
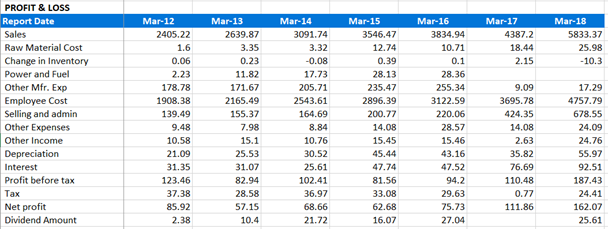
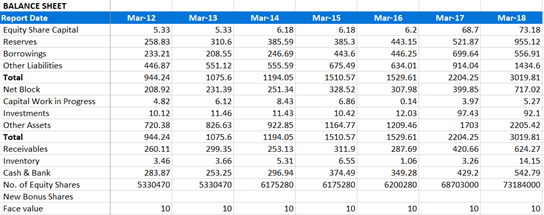
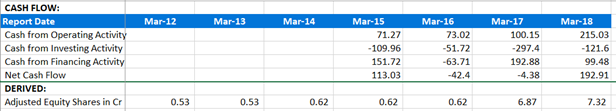
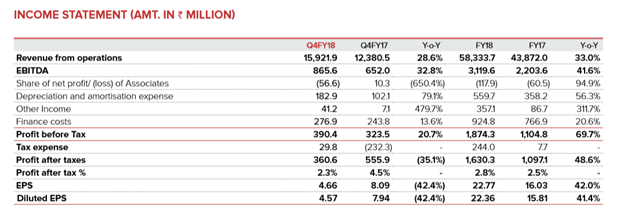
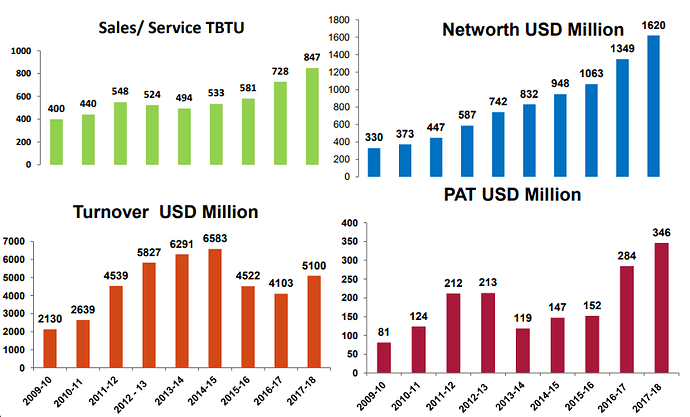
Key financials of the company:

image

Some of the measures taken to turn around the company include:

  • Increasing market reach with increasing exports: Over the years, the company has increased focus on export markets to reduce cyclicality associated with domestic markets.
    image

  • Empanelment with large EPC players: Despite its relatively smaller size, the company has been able to empanel itself with large global MNC EPC players and customers including Lurgi, Linde, Jacobs, Mitsubishi etc. The company has executed large projects for companies including Dangote Refinery (one of the largest refineries in the world), Reliance, OMCs etc. The key client lists include:
    image
    (source: Company presentation)

  • Improving designing and manufacturing capabilities – one of the rare companies with entire range of metal processing capabilities under one roof and excellent design capabilities

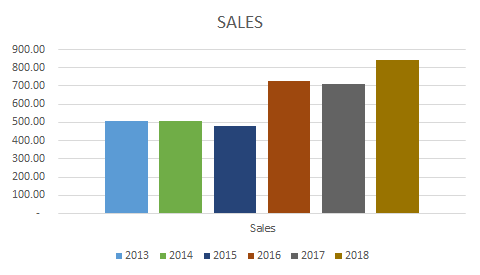
  • Increasing complexity and weight of the product manufactured: Over the years, the company has increased realization of the equipment manufactured by it as indicated in the graph below:
    image

  • Sticking to deadlines and avoided paying liquidated damages - Gained confidence of customers leading to repeat buys - Liquidated damages are one of the biggest cost.

Competition
The company competes with pure play heat exchanger companies including Patel Airtemp and Tema India (unlisted company) as well as large capital goods companies inlcuding ISGEC and L&T. Have done a comparison on the margin profile of Tema and Patel with Anup. Companies like ISGEC and L&T have much diversified product profile and are not strictly comparable.

Anup has highest margins amongst its peers and even better than much larger and diversified player – One interesting thing to note is the healthy GM of pure play heat exchanger cos which is much more than many capital goods companies.

Way Forward

  • All time high order book of the company – 300 crore by end of FY19 – largely from domestic market (might impact margins as guided by the management in its maiden concall post Q4FY19 results)
  • Expanding capacities – Target to spend 150 crore in capex for brownfield capacity in Odhav, Ahmedabad and greenfield capacity at Kheda – 40 kms from Ahmedabad – to be funded through internal accruals
  • Looking for further technological tie ups to enhance capabilities
  • Targeting 1000 crore over then next 4 – 5 years

What is attractive about the company?

  • Large industry size globally – new orders expected from all round the globe to improve efficiencies and cleaner fuels from refineries – Euro VI and BS VI implementation. Furthermore, the government owned OMC’s refinery are operating at 105 - 110% capacity utilisation and given the domestic demand of petrol/diesel with growth rates of 10 - 14% every year, these companies are looking at big capex over the next few years to expand their capacities.
  • Valuation – 42 crore PAT reported in FY19 and market capitalisation of around 500 crore currently. Healthy growth expected in revenues and PAT in FY20.
  • Attractive industry dynamics with many players reporting attractive gross margins
  • Net cash balance sheet and healthy cash flows.
  • Good feedback received from the industry peers about the company and top management.

Key Risks

  • Lumpy business – less visibility of revenue beyond one year. Furthermore, revenue can remain volatile on quarterly basis based on dispatches and orders in hand.
  • Largely dependent on oil & gas & petrochemical segment
  • Peak margins given it reported EBITDA margins of 25% plus during FY19. However, some comfort can be derived from company’s track record of reporting margins in the range of 24 – 28% over the past 5 years.
  • Working capital intensive operations - Its working capital intensive business with working capital cycle remaining between 100 - 180 days. These will also depend on dispatches during the year end.
  • Loans and advances extended to Arvind Ltd, its parent: Anup has extended interest bearing loans & advances of Rs.40 crore as on March 31, 2019 to its parent. However, the same can be called back depending on Anup’s fund requirements as per management.
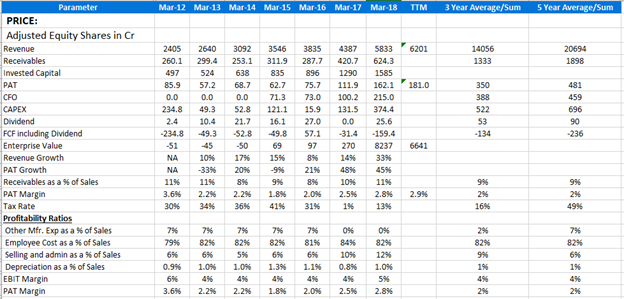
Key Financials:
Profit and loss & key ratios

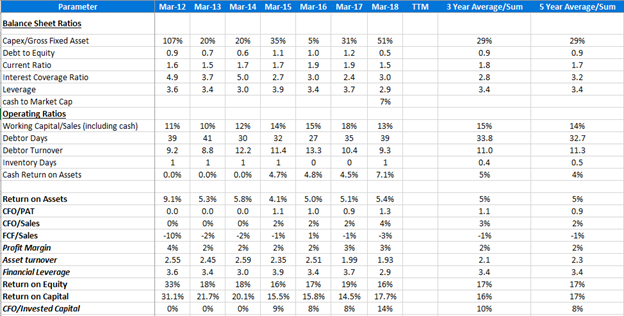
Balance Sheet & Key Ratios

(Disclosure: Invested. This is not a recommendation and anyone contemplating buying or selling should do their own diligence or take advice of their financial advisor)

Q4FY19 Results.pdf (2.8 MB)
Anup Engineering_VP Presentation_2019_For Uploading.pptx (923.0 KB)
Information-Memorandum_The-Anup-Engineering-Limited.pdf (3.0 MB)

Posts: 10

Participants: 5

Read full topic


My Portfolio_Homemaker

$
0
0

@homemaker wrote:

Hi ValuePickrs !

Belated Diwali greetings to all of you.

I come from non finance, non business and non tech back ground. I used screener for almost a year but never knew it comes from same family of ValuePickr. I am very new to investing in stocks and I find all financial formulas, ratios, graphs, macro-economic and political factors to be bit difficult. Having said that I have learnt few basic concepts of EPS growth, PE, PEG, ROE & CAGR from Investopedia( Its Like Wikipedia for finance). Few of my friends suggested Motilal WC study and after cursory reading I realized that above basic formulas are very important and basic. I have invested a small capital in 10 stocks in October 1st/2nd week and want to share my portfolio with you all for criticism and feedback. Thanks in advance !!!

Overall Rationale of investing

  1. 15% return on average. Approx doubling every 5 years.
  2. Max loss absorbing ability (30%).
  3. Limited no of stocks- max 10 as tracking, gaining knowledge is impossible for me
  4. Select a common set of (known names, past winners, present bargains, good outlook, and good ratios). Ideally all together but should have most of them
  5. Max 10 stock portfolio- any new addition will be after exiting one of them
  6. Holding period- min 1 year or -20% whichever comes earlier. Max- as long as growing

image

Posts: 286

Participants: 75

Read full topic

ValuePickr - Chintan Baithak 2019 Indian Equities Market Past Return

$
0
0

@dd1474 wrote:

Turn to Look at Return

While reading CSFB Annual return studies, which provide for Global Equities and other asset class return over the years and also for individual country, I realize that they did not have any return for the Indian equities. This led to me to search for return in Indian equities over the long period. While researching on the subject, I could not get hold off any study which provides insight before 1980s. Since Sensex has base year of April 1, 1979; most of the studies in India, take Sensex return as quasi benchmark for equities return.

While that is the best indication of return over last 4 decade, I still wanted to check what Indian equity market returns were over a very long period. I started collecting data from various sources on Google. The most important support to my study came from BSE historical eBook on their website. I downloaded most of this material and studied.

Approach 1: Bottom Up

While there was no indicative Index to calculate return, 1946 Year Book (which I believe a must read for anyone interested in equity market) provided detailed financials and valuation details for many companies. I took that as a base, put all information in excel and compile first approach of aggregating return from large surviving companies during 1945-2018 period. The approach has limitation as it does not consider diversification/ merger/ demerger of divisions and companies. The other limitation was while Banks like Bank of Baroda and Central Bank have survived; they were private bank in 1940s, nationalized subsequently and have constant equity dilution over 8 decades. Nevertheless, this provided whatever indicative return information for surviving companies.

Approach 2: Market capitalisation

While working on Capital goods sector industry study, we did compile data on Indian GDP and Gross Fixed Capital Formation from RBI and CSO website. From RBI website, I realize that we can collect Indian equity market capitalisation data for various years. Hence, I tried to compare decade wise growth in Market capitalisation and compared same with Constant Price GDP growth and Current Price GDP growth. One can consider difference between current price and constant price GDP as Inflation. While I have not checked whether we have inflation data since 50s from RBI, we can improve on same if get same.

The major weakness in this approach was also same as first one. There were frequent equity infusions over the period in the company and also new companies listing/ delisting of many companies. Hence, we do not have constant sample. I tried to address this problem by partially looking at past data from RBI which provided new equity issue. What I realize that range of equity IPO was in range of 0.5-1.5% of existing market capilisation. Hence, in order to adjust increase/decrease market capilisation, I applied around 1% reduction from market capilisation growth to get indicative equity return.

Approach 3: Adjusted Equity Index

In past Economic survey data, I came across another interesting concept by name of “Index of Variable Dividend Industrial Securities” (Old Index). This was indicator used by Government then to calculate return from equity market. I tried to search of Google about same and came across a Government Gazette which provided me over two decade value (with changing base year) for this Index. Accidently, we have April 1979 value of index being 100 while Old index values were also available for 1979. I started reworking on BSE Sensex and based on the Old index and got an adjusted index and calculated return of Indian equities over the period.

There are multiple issues and weakness in this approach. Index is adjusted with Rights and Bonus in Base and also with new company entry and exit of the company. For Old index, except for value, we did not even know which companies were included while calculating same.

The objective of this study is not to provide precise calculation of Indian equity markets over 7 decades. I have neither data nor expert knowledge to claim same. However, the objective was more the get indicative return. The slide in enclosed presentation is providing my finding. PLEASE READ THE DISCLAIMER SLIDE IN PRESENTATION.

I look forward to fellow forum member’s support to take this effort forward and work on improving on the finding. Feel free to send your feedback on this thread. I would also advise fellow members to go through excel sheet which used for working summary table in presentation.
BSE Old Data about Market cap VP.xlsx (228.1 KB)
Turn to understand past Return June 2019.pptx (68.0 KB)
BSE Ebook on 1945 https://ns.mstatic.in/LS/BSE_Book.pdf (Second book in list)
CSFB Year book on Return 2019
https://www.credit-suisse.com/media/assets/corporate/docs/about-us/research/publications/csri-summary-edition-credit-suisse-global-investment-returns-yearbook-2019.pdf
India Past Economic Surverys:
https://www.indiabudget.gov.in/economicsurvey/allpes.php
RBI Data on Indian Economy
https://dbie.rbi.org.in/DBIE/dbie.rbi?site=home

Posts: 12

Participants: 7

Read full topic

L&T Technology Services Limited- Unique ER&D Play!

$
0
0

@amishra wrote:

L&T Technology Services Limited (LTTS) is a global leader in Engineering and R&D (ER&D) services. Our ER&D services help customers innovate to build new products, minimize cost of development, reduce time to market, and meet the increasing regulatory demands. Partnering with 52 of the Fortune 500 companies and 51 of the world’s top engineering R&D spenders, LTTS offers cutting-edge solutions in the areas of Digital Engineering, Cloud, Analytics, Artificial Intelligence, Machine Learning, Automation, Augmented and Virtual Reality, and Cybersecurity.LTTS is a publicly listed subsidiary of Larsen & Toubro Limited, the $18 billion Indian conglomerate operating in over 30 countries.

LTTS provides E& RD in various segments like Industrial, consumer electronics, medical devices, transportation, plant engineering, telecommunication, semiconductors, media & entertainment

CEO- Mr. Keshav Panda has doctorate degree and worked in DRDO, ISRO. He has studied in IISC, IIT Bombay, Wharton and has 27 years of experience.

Financial Performance - From Screener.

  • Sales growing @ 13 % cagr (3 years avg)
  • Profit growing @ 18% cagr (3 years Avg)
  • ROE: 30%, ROCE: 38%
  • PE: 23
  • Debt Free

image image

Customer Geography
North America constitutes largest market with 57.6% of revenue share followed by Europe and India with 18.6% and 11.7% share respectively. Rest of the world contributes 12.1% of our global revenues.

Latest Quarter results are much better than past past cagr & is way above guidance.Highlights for Q2FY19

Q6 Q9 Q10 QoQ YoY
Sales 900.60 1,152.20 1,266.10 10% 41%
Net Profit 123.00 198.10 191.80 -3% 56%

From Website: https://www.lnttechservices.com/

  • Employees: 13000+
  • Customers: 235+
  • Repeat Business: > 90%
  • Patents Filed: 349
  • Acquisition: Graphene & Esencia

20:20:20 COMPANY VISION
As part of our 5-year Lakshya strategy, we have drawn up an organization wide roadmap termed as the 20:20:20 vision. This blue print envisions a sustainable 20% annual topline growth, complemented by healthy EBITDA margins of 20% and 20 new technology patents annually, which will achieve the momentum necessary to drive growth to $1 billion by 2021.

Industry Outlook
The $75-80 billion ER&D global services industry is expected to grow at a rapid pace (14-16 percent YoY) and reach a valuation of $145-155 billion by 2020.

Opportunities , Challenges & Risk

  • “Indian ER&D market is registering a combined annual growth rate (CAGR) of 13% since 2012. Our $24 billion is only 22% of global market size. The share of the US and UK continues to be big compared to India,”
  • India is Still a follower than a trend-setter
  • Limited global eco-system connect, lack of innovation culture and availability of converged digital and ER&D skills
  • Top 30 customers contributes more than 50% revenue. Concentration Risk
  • lack of large deals. 89 nos 1 mn deals and only 2 nos 50+mn deals
  • Over dependence on North America

Competition in India
TCS, Wipro, HCL

CRISIL CREDIT Rating
Total Bank Loan Facilities Rated Rs.250 Crore
Long Term Rating CRISIL AA+/Stable (Reaffirmed)
Short Term Rating CRISIL A1+ (Reaffirmed)

Disclosure
I am not a SEBI registered financial advisor. Initiated a small tracking position. This is not at all a Buy/Sell recommendation.

Request to VP members to share feedback !

Source of Information: Screener, Annual Report, Online eR&D market reports etc

Posts: 60

Participants: 29

Read full topic

WPIL Ltd - Global Water Pumps

$
0
0

@basumallick wrote:

WPIL is in the business of water pumps

  • The company is engaged in the business of fluid handling – from supply of pumps to turnkey project execution. It supplies a comprehensive range of pumps to the Industrial, municipal, irrigation and power sector. The company also has a strong project division which undertakes water management contracts in the above sectors.
  • Promoter holding increased from 66% to 68.8% on Mar-2018 to Jun-2018
  • About 33% of revenues come from Pumps and 66% come from spares & accessories. About 60% of revenues come from overseas subsidiaries / clients outside India
  • WPIL has ~20% market share in domestic conventional/engineered pumps in power, irrigation, city and industrial segments. It is the only dominant player in sewage and slurry pump (Government projects like Namami Ganga and clean Narmada in addition to most of municipal corporations going for sewerage treatment plants).

The co has 3 main divisions and strong international operations
Engineered Pump Division

  • Offers specialized water handling solution to conventional power generation, nuclear power solutions and industrial sector.
  • In FY18, supply of firewater pump package to ONGC, large axial flow submersibles to Thailand, metallic volute pumps to Telengana Irrigation was done

Conventional Pump Division

  • Standard pumps, largely utilized in the irrigation and water treatment systems
  • In FY18, execution of a major package for Telangana Water Grid, large order for Royal irrigation Dept., large number of high horsepower Submersibles for irrigation and water supply was done.

Infrastructure Division

  • Revenues of 170 cr in FY18
  • In FY18, execution on large water distribution projects in Madhya Pradesh and Rajasthan and an Irrigation system in Africa was done

International Operations

  • Company closed its operations at Mathers UK in July 2017 due to the continued downturn in the offshore oil market. The consolidated operations results were significantly affected by these onetime closure costs.

The co has many subsidiaries across geographies

Subsidiaries are key to operating performance and margins


Mathers Foundry has been closed down, so FY19 will see losses removed from it
Strong performance from Grouppo Aturia is expected to continue

Operations show improvement
Sales, margins and profits are on an uptick
image
image
image
image

Receivables & Debt seem to be a significant problem
Debt has reduced significantly from the past, but continues to be very high.
Receivables % is down to historical average levels, though still quite high on an absolute basis
In 2018, receivables > 1 year has jumped nearly 3x
image
image
image

All return ratios are improving; current ROE is less than half 2009-2010 ROE

Recent ROE improvement on the back of increasing margins


Risks & Issues

  • Company has very high debt.
  • Company has about 19% of receivables which are pending for more than 1 year.
  • Performance of the company depends on infrastructure spending. Any reduction can impact the prospects.
  • Since the performance is linked to infrastructure there is cyclicality in results. The company works across geographies to minimize such risk.
  • Currency fluctuations can alter revenues and profits as a large proportion comes for subsidiaries
  • As the company operates across many countries, political & currency stability is important for the company.
  • Company operates in a space where expenditure by clients is mainly discretionary. During down cycles, demand can shrink drastically.
  • The company does not publish consolidated results on a quarterly results. It is difficult to understand & track operations across subsidiaries.

Long term price chart shows a new high

Financial details


Disclosure - Details of Financial Interest in the Subject Company:
I currently do not hold the stock of the company discussed above in my personal portfolio. I am studying the business. Please consult your financial advisors before taking any buy/sell/hold decision. I may change my opinion post publication of this note and may not be able to update because of time constraints. The post is for educational purposes only. It is NOT a buy/sell recommendation.

Posts: 12

Participants: 9

Read full topic

Godrej Consumer Products Ltd

$
0
0

@pradip wrote:

Godrej Consumer.xlsm (249.8 KB)

The 120 Yr old company is going strength to strength in both India and outside. Though the company is a familiar household name in India, below I have put together a quick investment thesis-

Godrej Consumer Products is a fast moving consumer goods company, manufacturing and marketing Household and Personal Care products. The company has been nominated for CNBC IBLA outstanding company of the year award 2019.

Today, the Group enjoys the patronage of 1.15 billion consumers globally, across different businesses. In line with their 3 by 3 approach to international expansion at Godrej Consumer Products, they are building a presence in 3 emerging markets (Asia, Africa, Latin America) across 3 categories (home care, personal care, hair care). They rank among the largest household insecticide and hair care players in emerging markets. In household insecticides, they are the leader in India and Indonesia and are expanding their footprint in Africa. They are the leader in serving the hair care needs of women of African descent, the number one player in hair colour in India and Sub-Saharan Africa, and among the leading players in Latin America. They rank number two in soaps in India, are the number one player in air fresheners in India and Indonesia, and a leader in wet tissues in Indonesia.

Below are snippets from company’s financials based on screener data -

Total Income - The company has managed to grow revenue consistently over years. Though the growth has slowed in recent years.
image

Net Profit Margin - The NP margin has increased in last couple of years driven by cost savings initiatives initiated across markets. The NP margin is >10% and mostly stable which is a healthy indicator of pricing power the company enjoys. For e.g. the company is facing rising cost challenges in Argentina which it plans to pass over to customers.

Earnings per share - The company has been steadily increasing EPS over the years. The promoter holding is stable at ~63% over the years (no equity dilution)

image

Reasonable debt - The company carries reasonable debt on its balance sheet (<2 times of annual net profit). Too much of debt kills the profit and becomes a burden during stressed times.
image

Cash Flow - The company’s cash flow looks healthy. It has been generating free cash flow consistently. Generating free cash flow is a healthy sign as that shows that the company does not need a continuous investment in research and capacity build which exceeds the cash flow/profit it generates.

image

Return on Equity - The company has been improving its RoE in the last couple of years driven by increase in profit margin. RoE >20% is a good indicator of efficient capital allocation.

image

Inventory management - The company has been managing inventory quite well. The growth rate of sales exceeds that of inventory. Inventory pile up is a worrying sign as that indicates that the company has been struggling to push its products to the stores and eventually to customer’s homes.

image

Asset Distribution - The company’s asset side looks stable and healthy. Both receivables and inventory are stable over time.

image

Liability distribution - Though a quarter of the liability is debt, the proportion is stable over time. One of the reasons the company has to borrow from the market is to be able to fund its acquisitions both within India and outside.

image

The financials of the company look very pristine and healthy. Coming to valuation, the company currently trades at ~27X consolidated earnings. The PE ratio in the last 5 Yrs are ~31, ~30, ~38, ~28 and ~24.

The company’s Q219 concall and investor presentation inspires confidence of exciting times ahead. Given the successful history of the company, the company looks promising to deliver on the growth plans.

GCPLQ2FY19ConferenceCallTranscript.pdf (217.1 KB)

On the risk side, the following could hurt the company -

1.The company is facing challenges in generating returns in Latin America and Africa (company’s ~50 revenue is generated outside India). So if these markets don’t turnaround, the overall returns of the company will be reduced.

2.Some of the acquisitions in the past couldn’t perform well. The company sold its UK subsidiary in 2018. Though the company has hinted that it will be going slow on acquisitions, any non-strategic acquisition by the company will hurt.

3.New product launches could fail to impress the customers.

4.Govt initiatives like Swatch Bharat might hurt the sales the company generates from HIT & Good Knight.

I invite thoughts/comments on GCPL by all boarders!! @hitesh2710 @Yogesh_s @deevee @basumallick @richdreamz

Posts: 15

Participants: 10

Read full topic

DCB Bank - Steady performer

$
0
0

@bimalb wrote:

DCB Bank (DBL) is a midcap private sector bank with network of 333 branches and loan book of Rs186bn based in Mumbai, with presence across Retail, Agri, MSME and Corporate split is 52%, 17%, 12% and 19%, respectively.

On Basel III basis, 79% of Retail and Corporate assets comprise Retail. DCB Bank has displayed a loan CAGR of 125% over FY12-17.

DCB Bank has a CASA ratio of 25.7% and its cost of funds is 6.4% and, as a result, it registered a net interest margin of 4.1%. Its cost to income ratio stood at 62.3%. Consequently, it delivered a return on assets of 0.9% and a return on equity of 9.3%****, implying a financial leverage of 10.8.

MCAP - 7114 cr
CMP - 230
ROCE - 7.61
ROE - 11
P/BV - 2.28

Growth Trends: 10Yr 7Yr 5Yr 3Yr TTM
Sales Growth 23% 23% 22% 21% 0%
OPM 66% 67% 67% 67% 67%
PAT Growth -217% 29% 17% 19% 0%
Avg. PE 19.2 17.5 18.1 20.2 21.9

Management plans to double its balance sheet size in the next 3.5-5 years.

image

ROE declined during branch addition -

image

Most retailised mid cap bank on asset side –

image

Loan yield highest amongst peers below City union bank –

image

Higher loan yield also translates into higher net interest margin –

image

Well diversified and no high concentration risk to one big loan account going NPA.

image

PAN India approach and well diversified branches -

image

DBL already had a reasonably balanced branch distribution back in FY14, but it actively added branches in a manner whose by-product is the reduction of branch share in its then top region (western region) from 42% (as of FY14-end) to 29% as of end-February 2018.

As a result, DBL’s exposure to its top region (now, northern region) is 31% compared with 44-96% for mid-cap peers . This underlines the balanced, pan-India approach of DBL, which augurs well from a long-term scalability perspective.

image

Regulatory regime providing significant incremental fillip for bank lending to MSME segment, on which DBL is most focused

Formalisation of MSME segment due to GST increases the opportunity size for bank

Lending With the advent of GST regime and the ongoing formalisation of the MSME segment , a rising quantum of MSME business would be backed by formal documentation, which directly enhances the opportunity size in favour of MSME-focused banks such as DBL, diverting business away, on balance, from NBFCs disbursing loans to the MSME segment.

image

DBL’s credit exposure to the most stressed sectors of the Indian economy, viz. metals and Infrastructure, stood at 2.5% of total funded credit as of 1HFY18-end compared with 4.2%-27.6% for mid-cap peers. In fact, DBL is not disbursing any major new loans to the infrastructure sector.

image

image

image

image

Financials snapshot below –

image

image

Key Risks –

  1. Loan book stress due to loan against property business. It is known that large-ticket loan against property (LAP) business has undergone stress at an industry level due to dilution of underwriting standards on the back of hyper-competition. DCB presents highest underwriting skills till date.
  2. Proportion of corporate loans is kept within a band - Corporate loans are 17% of total loan book and management intends to keep the proportion similar going forward. This could be somewhat negative from a scalability perspective.
  3. High interest rates.
  4. Decline in GDP growth.

Views invited.

Disc - 10% of my portfolio, invested since 2017.
Please note that I am not an investment advisor. This post is for information purpose only. Please do due diligence before taking investment decisions.

Sources -


https://www.screener.in/company/DCBBANK/#documents
http://www.careratings.com/upload/CompanyFiles/PR/DCB%20Bank%20Limited-04-01-2019.pdf

Posts: 15

Participants: 8

Read full topic

Security and Intelligence Services (India) Limited

$
0
0

@suru27 wrote:

Company Introduction:
• SIS is India’s second largest and fastest growing security services company, 2nd largest cash logistic company and 3rd largest facility management
company in India. Also, the company is also the largest security services company in Australia through its subsidiary, MSS (acquired in 2008) with market share of 21%.

• Company came with an IPO last year

• Below snippets provide a details of company business

image image

Company structure:
image

Services Offered:

image

Company’s Journey:

The below table provides details of company’s journey and how it has evolved

image
The company has scaled up its operation by adding security guards year after year and has a national presence

image
image

Below graphs provide information about historical evolution of the company
image

Market Size Opportunity:

Company operates in manpower industry focusing on security management in India and Australia, Facility Management and Csh Logistics in India. In one of previous blog/post, I had written about market size opportunity which is available here:

In summary Rs 150000 Crore market size opportunity is open for company where company has currently 3% market share being in top 3 in each of the businesses. Also, there is an unorganized to organized shift also happening apart from high double digit growth of the industry in most of the business verticals except cash logistics which is undergoing a slowdown

image

image

The Jockey:

The company is driven by Rituraj Sinha who is son of a BJP politician (well reputed and father has no involvement in business now). I came across his profile while reading this book “The Consolidators” and this is an inspirational story for what he has achieved in last 15 years at young age of 36. However, it also highlights his risk taking abilities which has worked so far but something to be cautious about

image

Financial Performance

The company has been able to grow its topline and bottom line through both organic as well as inorganic mode with a healthy double digit growth rate. Also, slowly the share of Indian business is increasing compared to Australian business

image image

image

image

The company has been continuously gaining market share from competitors. Also, credit rating of some of competitors has been deteriorating off late. Company follows a decentralized model with better reach in tier 2 & 3 cities compared to number 1 player

image

image

Here is a break up details of each of the business vertical

Security Management Business India

image

Security Management – Australia

image

Facility Management – India

image

Cash Logistics – India

image

Overall Financial Performance Analysis:

The financial statement details are below:
image

image

image

image

The key highlights/questions of financial performance analysis are:

  1. Topline and bottom line growth has been very impressive
  2. Company has used debt as one of means to grow. However, its leverage position has improved
  3. Company is generating cashflow from operations which is good
  4. 600 Cr loan line open from Australian banks
  5. CFO/EBITDA = 69%
  6. Acquisitions will be fewer but bigger to fill geographical gaps or capability enhancement
  7. CFO generated from Indian business is only Rs 75 Cr
  8. Security SBU contributed 90% in 2016 but every year its share falling by 2%
  9. Revenue from Australia security is 57% and is falling by 4% every year
  10. Rs 220 Cr on Rs 1092 Cr capital employed but India contributes only 75 Cr, what is capital employed for India and ROCE? Specially considering Australian share of EBITDA is 48% but CFO IS 66%?
  11. Share of losses from associate companies should come down slowly
  12. Interest cost should come down
  13. Share of high margin businesses is growing
  14. Economies of scale should help
  15. Invested capital has doubled in last 2 years on new acquisitions, will it lead to better profitability?
  16. Margins increasing YoY but will it go up?
  17. Given scope for margin improvement and growth opportunity in terms of market size, is 30 times valuations too high considering the cash profit discrepancy between Indian and Australian business
  18. Why return on capital numbers not matching?
  19. Why tax paid was lower in recent years?

image

image

image

Other Relevant Information:

IPO Fund usage:

image

Subsidiary and JVs:

image

Management Remuneration:

image

image

Shareholding Pattern:

Other Key Points:
• ‘Man Tech’ services is adding human+technology, the solution aspect of security
• 2nd largest security provider , still, 3.5% market share
• Attrition down from 50% to 20%
• Some of top players not doing well as per credit rating report and SIS snatching market share
• Graduate Trainee Officer (GTO) – 6 month training
• 19 training institutes with 25000 capacity
• Revenue from Australia security is 57% and is falling by 4% every year

Opportunities:
• Australian business generating free cash flow of Rs 150 Cr
• Operating leverage possibilities in Indian security and higher margin facility management business
• Economies of scale possibility reflected in margin improvement
• Huge market size opportunities with high growth rate and unorganized to organized shift (PSARA act)
• Young and able promoter who is snatching market share from competition
• Increasing role of technology and service layer
• Ability to form JV with some of best international players
• Some of competitors not doing well which can benefit company (https://www.icra.in/Rationale/GetRationaleFile/63102~Tops%20Security%20%20-R-06102017.pdf)

Risks:
• Low margin and low barrier to entry business
• Indian security business on a revenue of Rs 2144 Cr has made hardly 15 Cr cash profit and Rs 65 Cr accounting profit. So, basically, most of cash profit is coming from Australian security business or facility management business. So, Is Indian security business worth consideration despite of all growth projections? Also, loss making subsidiaries
• Auditors have not audited foreign subsidiaries which includes Australian business which is a major cash profit contributor
• Provisions as a % of PAT seems very high, getting rid of unviable contracts
• Bulk of balance sheet asset is goodwill acquired from multiple acquisitions
• Company has historically used debt as a vehicle for acquisition
• Not sure if company has adequately hedged the loans it has taken from Australian sources
• Possibility for recession in Australia
• Operational, reputational and political risk
• RBI regulations on cash logistics business will lead to higher cost on security related expenses and hence may not give adequate profitability. Also ATM installations stagnant and pricing pressure increasing
• Aggressive acquisition history
• High attrition industry and company’s attrition is 20%
• Litigations related to labor laws (Rs 20 Cr quantitative impact)
• Regulatory wage hike
• Dependence on JVs and partners to grow

Overall Summary:
• In India, it is a high growing industry (15-20% CAGR) which is still highly non-complaint and unorganized
• Very less entry barrier and very less margins
• Relatively, facility management area seems to be a better area and has higher
• Catering management is another emerging industry ($B dollar businesses in developed nations like Sodexo, Compass group) with better financial ratios slowly picking up in India
• Security management is a low margin business where market leaders are trying to add technology services layer over pureplay manpower. Economies of scale might lead to margin gains
• Formalization of economy, compliance, PSARA act etc. might give additional benefit to organized players
• Compliant players are gaining market share. Government (specially Railways) could be a big opportunity

Valuation Rationale:
• For global staffing companies, the average one‐year forward PE is 15.5x, while EPS CAGR stands at only 9% (PEG of 2.1x).
• In this context, considering that TeamLease and Quess are estimated to clock 24‐31% EPS CAGR, their PE multiples of 33‐35x (PEG of 1.1‐1.4x) are not expensive, in our view.
• Also, RoEs of Indian and global companies are similar and hence the high growth in India justifies our implied target multiples.

image

Current price is almost 25% down from the above analysis done by Edelweiss. However, I believe that there are critical questions on overall business model viability and sustainability which are still open and need to be addressed before doing any kind of valuation exercise.

Key Questions for Management:

  • Indian security business on a revenue of Rs 2144 Cr has made hardly 15 Cr cash profit and Rs 65 Cr accounting profit. So, basically, most of cash profit is coming from Australian security business or facility management business. So, Is Indian security business worth consideration despite of all growth projections? Why Indian security working at <1% cash profit which means very poor return on capital?

  • Status of loss making subsidiaries

  • Auditors have not audited foreign subsidiaries which includes Australian business which is a major cash profit contributor

  • Provisions as a % of PAT seems very high, getting rid of unviable contracts

  • Fixed cost of branch and hub opening (capex fixed + fixed nature in opex)

  • Optimum revenue limit at branch range

  • Bulk of balance sheet asset is goodwill acquired from multiple acquisitions

  • Company has historically used debt as a vehicle for acquisition

  • Not sure if company has adequately hedged the loans it has taken from Australian sources

  • Employee count different, ROCE difference

To do list:

  • Study other companies in similar business : Teamlease, Quess Corp, Apollo Sindoori, Karya Facilities, ANI Integrated Facilities

  • Study JV partners how they have done in respective countries

  • Study world leaders like Sodexo, Compass Group

Disclosure:

I have a tracking position in this stock and this is still under study

Posts: 17

Participants: 10

Read full topic


Petronet LNG Limited - Green India with Clean Fuel

$
0
0

@dineshssairam wrote:

Petronet LNG Limited (https://www.petronetlng.com/Company.php)

Company Overview

Petronet LNG (PLNG) is the market leader in the LNG receiving and regasification business in India. The company has set up the country’s first LNG receiving and regasification terminal at Dahej, Gujarat, and another terminal at Kochi, Kerala. While the Dahej terminal has a nominal capacity of 15 MMTPA, the Kochi terminal has a capacity of 5 MMTPA. The company is in the process to build a third terminal at Gangavaram, Andhra Pradesh. A couple of other important plants are also in the plans.

Formed as a Joint Venture by the Government of India to import LNG and set up LNG terminals in the country, it involves India’s leading oil and natural gas industry players. Their promoters are GAIL (India) Limited (GAIL), Oil & Natural Gas Corporation Limited (ONGC), Indian Oil Corporation Limited (IOCL) and Bharat Petroleum Corporation Limited (BPCL).

Business Overview

To put it shortly, PLNG’s business follows the below cycle:

  1. Sign long term, fixed price contracts with gas suppliers from overseas. Currently, they have signed such contracts with Gaz de France and Ras Laffan LNG Company.
  2. Process the purchased gas in liquefaction plants
  3. Store them in LNG storage tanks.
  4. Sell them to Oil & Gas clients, after which the gas will be vaporized and transported via gas pipelines. The buyers are largely IOCL, BPCL, GAIL and ONGC as of now.

PNG

Industry Overview

The quest for alternative fuel has been a common denominator in most parts of the world. Closer in Asia, India and China have been spear-heading the change.

Even if India were to simply move towards the global average power mix, it would still mean a massive shift towards gas:

PLNG’s direct competitor, Shell, came out with a statement expressing their enthusiasm about the LNG market prospects in India:

Other news articles also follow through:

https://www.lngworldshipping.com/news/view,lng-in-india-in-with-the-new_54423.htm

But in fact, the overarching story is that the Supply-Demand situation for gas in India is highly skewed. Supply is only a fraction of the projected demand:

DS

Considering how the domestic gas supply isn’t up to the mark, LNG imports will have to be boosted to fill in the gap.

Business Analysis - SWOT

Strengths

  • PLNG has the highest market share in this space and can play a huge part in bridging the demand-supply gap in LNG imports and regasification.

  • PLNG already has large plants at low capacity utilization levels. If the demand for imported gas indeed picks up, the operating leverage can kick in to aid profitable growth.

Capacity1

  • PLNG is also largley the face of India’s LNG import talks with foreign nations. So if there’s a list of companies that can successfully discuss profitable LNG import deals for the country, PLNG would probably figure at the top of the list.

Weaknesses

  • When all is said and done, the regasification business is a commodity business and therefore, reliant on supply and demand of raw material (Here, gas). Any high-demand situation in gas abroad can dent PLNG’s margins quite easily. However, currently, the prices seem to have stabilized.
  • Since the firm largely supplies to the Oil & Gas giants of India, bargaining power with customers is non-existent. On the other hand, the firm imports gas based on long term fixed-price contracts. So once again, bargaining power with suppliers is also quite less.

Opportunities

  • As already discussed, the upcoming push towards green energy and a lack of local gas production offers a lot of value to the company on a golden plate. It’s only a matter of how large a piece of the pie the company can claim for itself.
  • The company has also been applying (Although highly unsuccessfully) for City Gas Distribution License (Source 1, Source 2). If PLNG could somehow win a license, it will mark a foray into a new, prosperous, challenging segment with its own set of opportunities.
  • In the past few years, the company has been negotiating gas import contracts with more suppliers (Exxon in Australia, Henry Hub in USA to name a few). Done successfully, this will spark a price war and hopefully, PLNG can get their raw materials at a cheaper price. The diversification of raw material sources also comes as an advantage.
  • If and that’s a big if, PLNG can negotiate shorter term contracts instead of long term contracts, raw material prices can come down significantly. My memory slips where I read this exactly, but the difference could be as much as 50% lower.

Threats

  • A great profit opportunity attracts several competitors and the regasification business is no exception. PLNG’s capacity to supply far exceeds the competition. But it is always good to look out for dark horses.

Financials

Mandatory linking to Screener. But I sincerely suggest that you check out the report by Ventura. They have done an excellent dissection of the numbers related to the business.

Valuation

In my opinion, depsite the run-up in the stock’s price, it looks to offer some value.

However, please note that the above valuation is done at a Cost of Capital of ~12.5% and a Margin of Safety of 30%, both of which I think are not enough. Considering the commodity nature of the business, these should be a tad higher. So a valuation tainted by my personal risk-reward opinion would look like this:

TLDR is, PLNG is not my cup of tea. But it could be yours, depending on your own risk-reward tendency.

Red Flags / Risks

  • PLNG is a state-owned entity. So, there is no question of Corporate Mis-governance here. But of course, the same fact also appears as a red-flag. We know the fate of several state-owned entities being the playthings of politicians. It is not too farfetched to assume that PLNG could join the pack during the upcoming flood of LNG demand.
  • 50% PLNG is owned by 4 Indian Oil & Gas giants. Not only do they own 50% of the company, but they also sit on the board of the company (Talk about independence of the board). The cherry on the cake, these four entities are also the sole customers of the company (Well, almost). You can probably do the rest of the math.

Disclosure

I do not hold any position in Petronet LNG.

Important References

PLNG’s Annual Reports
Ventura Research on PLNG (A MUST READ research report on PLNG)
PLNG’s Corporate Presentation
Petronet LNG - Wikipedia
List of LNG Terminals in India

Posts: 18

Participants: 7

Read full topic

Portfolio for 2025

$
0
0

@RadheyShyam_Aggarwal wrote:

Had sold everything in December 2017 as got scared of valuations.

Recently re-entered the market , here is my portfolio.

Invite views of senior and experienced members. Thanks in advance

Picture3

It is skewed towards Real Estate and aligned sectors - 41%
2nd biggest is Pharma and IT - 20% each

Posts: 137

Participants: 39

Read full topic

Titan Company Ltd : a three decade old company

$
0
0

@gurramlokesh wrote:

I’m wondering there is no thread on Titan so far. Please let me know if there is an existing thread

The company has 3 main businesses - Jewellery, Watches, and Eyewear.

Revenue breakup 2018 2017 2016 2015 2014
Watches 2060 2,058 1977 1936 1814
Jewellery 13126 10,509 8621 9309 8525
Eyewear 414 413 373
Other 556 402 339 668 588
Total(Cr) 16156 13382 11310 11913 10927

Watches (12.8% of Total Revenue)
Titan is the market leader in the Watches Segment. It started operations in 1986 and currently has around 60% market share. It sells mainly under 3 brands FastTrack, Helios, and World of Titan.
Revenue growth has been around 3.23% CAGR for the past 4 years. Much growth in this segment can’t be expected. It acquired Favre Leuba in 2011 to enter the luxury watch segment. But nothing much has been made out of it.

Jewellery (81.2% of Total Revenue)
This has been a consistent business driver for Titan. It sells under different brands - Tanishq, Zoya, Mia, Caratlane. It has grown from 30% of total revenue in 2002 to more than 80% in the last fiscal year. It has a CAGR of 20.5% in the last ten years. Operating profit margins are improving.
Thanks to Demonetization, GST and subsequent introduction of PAN which helped the organized players like Titan.

Eyewear (2% of Total Revenue)
Though it is a very small part of their overall revenue, Company is betting big on its eyewear business and planning to target 10 million customers in five years. But the growth has been not so great, with falling Operating margin.


The company has this to say regarding falling Operating Profit Margins:

“Company witnessed 16 % growth as compared to the previous year but profits are limited and that’s because advertising spends eats up margin. But that’s how you acquire new customers by making them aware that you exist.”

Investment Rationale

  • Very few listed players to play on Consumer gold consumption
    (opinion: Indian Gold consumption is not growing to reduce for the foreseeable future)
  • Push for organized Gold Consumption
  • This is a TATA group company, so not have to worry about Corporate Governance or management succession.
  • Company is trying to stay relevant with trends (Acquired Caratlane - online jewellery seller mainly focused on working women)

Risks

  • Regulatory risks - RBI has changed its stance on Gold import mechanisms multiple times in the past
  • Not so great eyewear business- I feel it is hard to compete with online players like Lenskart(Subjective opinion)

It would be helpful if other board members can share their insights on Titan
Disclosure: Not invested. Looking for investment oppurtunity.

Posts: 41

Participants: 26

Read full topic

Navaneeth's Portfolio

$
0
0

@navan1983 wrote:

Dear Friends,

ABOUT: -

I have been involved in the stock markets since 2007. But I have not made any money as I have not consistently invested in the markets. I have been reading through valuepickr posts for all few months.

I also do short term trading depending upon the market conditions. I also try Options. I would like to have a long-term investment portfolio and would like to start with a fixed amount & do SIP. In this thread, I would like to discuss only the long-term investment & get the feedback from the esteemed fellow members.

OBJECTIVE: -

I am 36 years old with 2 kids. With this portfolio, I would like to invest long term & generate Alpha returns and would like to use this for kids’ education/future.

My Objective is to have CAGR of 15 to 20 percent. Also, I would like to invest mostly in large caps since capital preservation is equally important.

INVESTMENT PHILISOPHY: -

Invest around 15 to 20 stocks. Have a watchlist of 10 stocks and shuffle during periodic evaluation.

Invest in sectors that are appreciating and invest in leaders (Example: - Private Sector Banks, Consumer Durables, Insurance. Etc.).

Avoid Cyclicals as much as possible.

Invest trend changers. (It is very rare to find in Indian Markets. But would like to find that can do).

Avoid PSU’s. (Although most of the companies are good & have value. With government policies, it is very tough to make any value for Investors. Who makes money here?)

Avoid Sectors that might lose value. (Automobiles – with the sharing model, this is definitely a disruption).

Do periodic evaluation of portfolio every 3 months. (I don’t think the idea of coffee can period with so many disruptions happening in the last 2 decades).

PORTFOLIO: -

Stock Percentage of Allocation Investment Rationale
HDFC Bank 8 Leader in Retail Banking. I strongly believe HDFC Bank will be the next HDFC Bank itself.
HDFC 8 Market Leader in Housing – with push for housing and all the problems with housing companies. It is better to stick to it.
Larsen 5 Infrastructure play
TCS 7 IT – Market Leader. With the growth it has shown in the last few years, it is a must have. Infosys & HCL Tech are also slowly losing the competition to TCS.
HDFC LIFE 5 Insurance. With western culture being replicated, I am pretty sure we will be buying insurance for everything in the next decade. This is one sector that I am very optimistic about.
Asian Paints 8 Paints / Consumer Play. With the middle class growing & the growth shown by the company, it will continue for future.
Marico 7 Consumer Durable play.
Pidilite 5 Market Leader in Adhesives.
Kotak Bank 7 Private Sector Retail Banking.
Bandhan Bank 5 My Bet. If it can be successful in EAST India, it can be definitely do in any other parts in India. Also, with the merger with GRUH Finance
Bajaj Finance 7 Market Leader in Consumer Finance. The leadership & the process that they have to approve consumer loans, it will continue to grow. It might be challengeable but with the scale they are doing across PAN India, it has the extra edge.
ITC 6 Diversified presence in Cigarettes, FMCG, Hotels. Price of the stock does not seem to reflect it.
Reliance 6 With the money that they get from refinery, they are ready to invest into other sectors like Retail, Telecommunications. Will closely watch how it performs in the next few quarters.
LTTS 5 Leading global ER&D services company.
Godrej Consumer 5 FMCG Play. Bet in African markets for Godrej Consumer seems to be challenging.

Since we are in a bear market phase, I would like to stick to the proven leaders. Once the market condition changes, would like to consider other options.

Please provide your valuable suggestions and help succeed to part of the investment journey.

Posts: 19

Participants: 12

Read full topic

Portfolio for 2025

$
0
0

@RadheyShyam_Aggarwal wrote:

Had sold everything in December 2017 as got scared of valuations.

Recently re-entered the market , here is my portfolio.

Invite views of senior and experienced members. Thanks in advance

Picture3

It is skewed towards Real Estate and aligned sectors - 41%
2nd biggest is Pharma and IT - 20% each

Posts: 135

Participants: 38

Read full topic

Innovators Facade Systems Ltd

$
0
0

@Adhiraj wrote:

Overview

Facades are the exterior sides of the buildings. They are important from the design point of view. From an engineering point of view, they are important these days as they have a great impact on energy efficiency and costs.
Innovators façade systems limited is an Aluminium Facade contractor for designing, engineering, fabrication and installation of all types of facade systems. The company is headed by Mr. Radheshyam Sharma and has executed total orders of than 1100 crores since inception. He has about two decades of experience in the construction industry.

It has installed facades for many big construction projects such as

Airports (13 of them) – Chandigarh, Indore, Kolkata , Mumbai,etc

Residential - World view Tower

Commercial(for clients like) – DHFL, JW marriot, TCS,etc

And boasts of reputed clients such as AAI, Reliance Industries, Aditya Birla Group, Tata Group, Godrej, Infosys, Cipla ,etc as listed on their website.

All other projects and clients are mentioned in their website.

Financials and Valuations

image
image
image

The stock has been hammered like most of the market and is near its 52 week low.

FY 2019 results

Annual Report and other Documents

https://www.screener.in/company/541353

Credit ratings

https://www.icra.in/Rationale/ShowRationaleReport/?Id=76243

http://www.careratings.com/upload/CompanyFiles/PR/Innovators%20Façade%20Systems%20Limited-10-23-2018.pdf

ICRA has given B+ and A4 rating for its fund based -cash credit and non fund based -bank guarantee.

CARE has given BBB rating for long term loans of 31Cr and A3 for short term loans and bank facilities of around 60Cr as of Oct 2018.

Brickworks has a BB+ rating for long term facilites but put in a disclaimer stating that the issuer did not cooperate. This is a thing to be concerned about.

Management interview and important points

image

Management interview before the IPO on Zee Business

Query about the company on Zee Business

Shareholding Pattern and Key Investors (As of June 30,2019)

One of the major reasons I became interested in the story and wanted to explore it was presence of marquee investors in it. Their presence shouldn’t hamper our judgement but it is well worth a look.

  • Promoter Holding is around 62%.
  • Vijay Kedia has a 10.14% stake. He initially had a stake around 6% in pre-IPO and has increased it gradually to above 10%.
  • Pantomath Sabrimala Aif Pantomath Sabrimala Sme Growth Fund Series I has a 1.07% stake
  • Madhusudhan Kela owns 3.76% of the company.

Underlying Investment Thesis

Indian facade industry is expected to grow by 20% yoy and Innovators facade is one of the major players in facade industry. It is the only listed player at the moment and available at a market cap of less than 100Cr while the market is valued at 15,000Cr and expected to grow rapidly as use of facades increases in newly constructed buildings. It is one of the few organized players in this segment and boasts a portfolio and well-established projects.

The company had revenue of around 100Cr in FY17 which grew around 50% in FY18 to 154 Cr but remained steady to 157 Cr in FY19. Margins declined in FY19 which led to decrease in profitability from 7.91 Cr to 4.65 Cr. As a result, the stock has been hammered to almost half the IPO price and available at close to book value. It had a 300 Cr order at start of FY19 and if the management is to be believed, order book is not a challenge but their capacity to deliver on it is. Given the huge demand and growth of the industry, attractive valuations, presence of marquee investors and a huge order book, this business seems like a story worth exploring. There are certain risks I am certainly aware about and they should be taken into consideration while evaluating this business.

It is an interesting story and if management plays it right, it can generate good returns due to its huge market potential.

CMP - 34.5
Market Cap - 65 Cr
Book Value - 36.21
P/E - 8.22
ROCE - 18.28
Debt to Equity - 0.77

Risks

  • Illiquid stock - Difficult to get out once invested. Especially if the company underperforms or falls in some trouble.
  • High Debt - Money from IPO helped them to reduce their debt by half and to help them with their working capital requirements. But still total debt(long term + short term) is at a high level when compared to shareholder equity and liquidity.
  • Management Risk – Not much information is there available on the management. The board is led by father-son duo. This point is important because there has been great erosion of wealth in many companies in the past couple of years majorly due to management issues i.e. bad ethics and bad capital allocation. So, it is important to keep an eye for it.
  • Lack of information available – There is not much information available about the company and it is not covered by any research analysts. This makes it hard to evaluate the business. Also, I was not able to gather much information about its competitors from India and outside India. A simple façade google search will show some of its competitors and a few of them have completed some impressive projects.
  • Company’s operations are working capital intensive and have high receivables and inventory days. Also, the revenue from top three customers comprised 40% of their total revenues in FY18. Majority of their contracts are from Maharashtra and Delhi. This exposes them to the risk of geographic concentration and client concentration.

Other Information:

  • Bankers – Indian Bank, Oriental bank of Commerce
  • Auditors – S G C O & LLP
  • Listed only in BSE
  • Had IPO in May 2018 at BSE SME platform

I am a new investor and this is my first write-up on this forum. Please tell me if any inconsistencies are present in this write-up. I will be happy to correct them and grateful for inputs.
Fellow valuepickrs, please share your thoughts regarding this opportunity.

Disclosure: Invested small tracking amount and looking for more clarity. Interested in the story as I feel it has great potential.

Disclaimer:

I am not a SEBI registered analyst or a financial adviser. This post is not a recommendation or endorsement in any way. Please exercise caution before making an investment decision.

References:

http://innovators.in/

Posts: 10

Participants: 7

Read full topic

Technical's for the Fundamental Investor

$
0
0

@P-Shekhar wrote:

Allow me to give a small intro… Initially about 10 years back i tried to use pure Technical’s for all trades along with back-testing results. Though success was good, there were also a lot of failure bring down profit strike rate. I used to employ dozens of indicators, etc leading to a very cluttered chart. Over the years as any analyst does, i developed my own system of un-cluttering my desk and tossing out most of what i learnt out the window and keeping it as basic as possible. I shifted from lower frames like daily to larger frames like weekly and finally settled on monthly. For things to work on a monthly frame, trade holding period can be hugely extended to say, even 10 months to over a year. But since my approach was to target around 4-6% compounded per month, final sell profit dictated how much i made. It worked very well. Then came trying to better the system by not just choosing any stock just technically and trying to find “safer” stocks. There came in the need for fundamental analysis to help choose the stock. Since FA (fundamental analysis) works on the tenet of finding stocks way below intrinsic value; it also meant the stock would have to be at monthly/yearly lows technically or at least 40-50% below prior peak price. There are other similar threads on VP that seem to think on similar train of thought. I would like it to widen the scope a bit more.
The idea of this thread is to welcome Investors with fundamental thoughts, using P/L, BS, Cash Flows, etc to be able to time their entry for longer term holding as perfectly as possible. Note that only technicals can provide this entry. A stock which has corrected say, 60% from peaks may seem very cheap in value fundamentally, but the TA (technical analyst) may see chances of further 20-30% correction , hence it’s all about the timing.
My hope is that more TA’s will join me on this thread to help Fundamental investors make better entries into stocks and try to find the most appropriate time to exit also on stocks of “their” choice i.e. give us the stock name you are tracking and I/we will help you analyse best time for entry and exits. Coming to exits; though entry into stocks is usually the easy part irrespective of price, it’s the exit which can prove dicey. This is where the game of stretched valuations/technical peak Vs greed comes into play. If my objective for a stock X bought at say, 100 is to make 70% per annum over a 1-1.5 year period, then when the stock actually does do 170 in a year or about 200 in 1.5 years time, sometimes strong momentum may seem to hint further upside of another 50-60%. Here is where our personal trading/investing rules have to be applied as to “How much is enough”. That would be a personal issue. I tend to take my profits off above 70-100% P/A when i get. Logic is sectors move in cycles and when my stock X from a given sector is at peak, there is usually some other sector which has not been in flavour and is at yearly lows at that time, hence i rotate cash.
Would also like to mention a word about “multibaggers” here. Most consider a multibagger to be an unknown small cap bought at very cheap levels which may go on to multiply many times over the years as intrinsic value approaches. Using the technical method i follow, one can “make” any stock a multibagger provided the company itself is fundamentally sound. I would rather put my money into known companies like small-medium mid-caps bought at yearly lows and allow them to do 6-7 X in 4-5 years rather than try my luck at companies with lesser data and less experience no matter how attractive the business model is. Eg., i would rather buy into say, Escorts at 460 and hold for 3-4 years for 1750-2100, rather than buy say, ChamanLal Sethia exports at 80 and wait for 240 in years to come. Not that Chaman cannot do it. Just that i would have more conviction in a company like Escorts…
looking forward to a favourable response from all interested in making this thread a success and more importantly, sharing different schools of thought applied together to create better wealth !!!

Posts: 27

Participants: 11

Read full topic


Apollo Tricoat Ltd(ATL)

$
0
0

@narendra wrote:

Apollo Tricoat Limited (ATL) journey:

It was initially incorporated as “Potential investment and finance ltd” in 1983 and acquired by Mr Saket Agarwal by open offer in 2016. Subsequently name was changed to Best steel logistics with major areas of business as warehousing,logistics and trading activity of steel.

In 2018 Mr Rahul Gupta(RG) son of Mr Manoj Gupta(Chairman of APL Apollo tubes) has acquired controlling stake and changed company name to Apollo tricoat ltd and started setting up plant near Bangalore for manufacturing of tricoat tubes.

By FY18 end RG has increased his shareholding to 31.25% (80,30,000 shares) from 5.41%(for FY17) by preferential allotment of eq shares and warrants(48,00,000 @Rs.120.00)

During OCT 2018, LAXMI UDYOG LTD ( Subsidiary of APL Apollo tubes) did purchase agreement with RG to acquire his eq shares, 43,00,000 eq shares after warranty conversion @ Rs.120 and 79,30,000 shares from public with open offer @ Rs.135. As per latest shareholding promoter and group hold 64.33% in ATL.

This whole process looks complicated to me, request vp expert @phreakv6 to comment.

(What I have written below is based on annual reports,scuttlebutt,plant visit,discussion with people involved in steel industry. My interpretation may be wrong in few things.)

Apollo tricoat has set up its plant near Bangalore for manufacturing of tricoat tubes,designer galvanised tubes,narrow sections…etc.(to know the difference between pipes and tubes@ HERE)

Normally steel tubes are produced from from HR coils. When plain HR coil converted into tube it has to be wielded at the point of contact and tube has to be covered with zinc to prevent rusting. Once tubes are made into round tubes they are cut and dipped in zinc bath. Making round pipes and zinc coating by dipping in zinc bath is easy but making in rectangular or square shape and zinc coating is not easy. When tube is made into rectangular/square shape zinc coating inside is not uniform and when air is blown inside to clear zinc impurities the distribution of zinc inside the tube gets altered.

To overcome the above, plain HR coil itself is dipped in zinc bath and later converted into tubes/rectangular section tubes which is called as GP Pipes(G- GALVANISED, P-PLAIN HR COIL).Problem with GP pipes is loss of zinc coating at the junction of wielding making it prone for corrosion.

Apollo tricoat has got inline galvanizing technology from a US company for which they seems to have paid good money. Using this technology the HR coil converted into tubes/sections, wielded, coated with three layers. Interior of steel tubes by zinc paint,outside by zinc galvanisation which is in turn covered by polymer coating making it corrosion resistant with smooth surface. The whole process happens inline continuously without any loss of continuity during the whole process.

Presently one line of tricoat tube has recently started with production capacity of 7,000 tons /month on two shift basis. The present line is still facing minor stabilization issue which will be solved completely. Trial batch has been dispatched and seems to well accepted by market. Present line can produce 0.5 to 2.5 inch size tricoat tubes. Different sizes of tubes can be produced by replacing the machine parts through which HR coil passes through. HR coil of different dimension is used depending on requirement ,size…etc

Benefits of technology: Greater corrosion resistance,greater yield, and tensile strength(see the presentation). As tube is wielded before coating,even the wielded area is as corrosion resistant as rest of the tube(which was problem with GP pipes).

Benefit to company is better margin compared to GI pipes (Rs.5-10/kg more than GI pipes/EBITDA margins are 2 times more compared to GP pipe as mentioned in APL concall) due to cost saving by inline process and less use of zinc.

ATL has target is to sell 30,000 tons of tricoat tubes for FY20. Another line for tricoat tubes will be installed in next 1-2 years.

Uses: Tricoat tubes will offer more life,better strength and corrosion resistance for roof top sheds.(kerala seems to biggest market of 30,000 MT per month for galvanised pipes.). Green House is emerging in India, through tricoat tubes we will be offering pre fabricated solutions to greenhouse supplying contractors.In developed countries its compulsory to use steel tubes for electrical conduit instead of pvc in high rise buildings. Presently there is no such trend in India but we can explore the market in future.

They have technology agreement with US company not to sell the technology to any other company for five years. Once ATL install another line in next 1-2 years US company can not provide technology for another five years. Apollo has to buy specific machinery provided by US company as nobody else can do. Don’t think anybody else will do it also as its expensive technology. Even globally just 4-5 countries have such product line and in each country its monopoly.

(Technology provider seems to be “ALLIED TUBE AND CONDUIT” which is a part of listed company “ATKORE INTERNATIONAL”. Allied tubes and conduit has patented FLO-COAT® inline galvanising technology which is similar to Apollo tricoat technolgy. My limited to search to look for market size,margins of Flowcoat tubes through Atkote international AR did not yield much results. For more details refer http://www.atc-mechanical.com/mechanical-tubing/flo-coat/ and http://www.atkore.com/about-atkore/.)

Another line for door frames, designer galvanised tubes is in progress and will be operational in few months. Here HR coil goes through normal galvanising process but the tubes will have designs over the surface which is used for various domestic household uses like gates,window frames,railings…etc. Nobody else in India have this technology or producing it.This We have learnt from others outside India with the help consultant we are going to produce it. We will be making profiles and sent to our other division where it will be modified as per customer requirement. We will be replacing wood products by our steel products.

Steel companies produce thicker sections of HRC. Presently hrc coils of 1.4 to 1.2 mm is not available in market. We are putting cold rolling mill where these hr coil will be converted to thinner sizes using which small size section tubes of ¼ inch to 1.5 inch will be made. Thin sections by cold rolling mills of ¼ inch to 1 ½ inch for meeting customer requirement of frames,railings etc. This will be operational in six months. We have procured all the necessary machines and planning to commission every line over next few months ( including GP line?).

As we are supplying these pipes to premium market we want to pack both ends with plastic caps for better management during transportation. We are thinking to install machines for making plastic caps. For 200 tons of pipes per day dispatch requires 1000 to 2000 caps per day.

Hybrid pipes: plan for 10,000 tons capacity in a new plant nearby. Here galvanised steel tube is coated inside with PVC. This hybrid pipes can be used for drinking water purpose and it can be replacement for CPVC pipe.

Tricoat tubes will be sold through same distributors of APL tubes.Normal credit period of around 30 days. Raw materials will be sourced from JSW steel.

As per APL tubes concall EBITDA for GP pipe is around 5,000/ton. Going by the commentary tricoat will make 2 times the EBITDA margin i,e 10,000/ton(RS.10/KG)

Even if Tricoat able to sell 30,000 tons in FY20, they will be earning EBITDA of 30 Cr for FY20.

Financials: Does not have value as past business was entirely different. Below is performance of company (best steel logistics)

Questions:

  1. Acceptance of product: As its new technology with stated benefits of corrosion resistance,long life and better strength. Will customer note this differentiation and buy this new product?
  2. Even though ATL has agreement with US company,seems like there are companies in other countries which are using the same technology. Any Indian company may tie up with them and increase the competition.
  3. Why it’s monopoly business in different countries? Why only limited no of lines are functioning? Does the market size of tricoat inline galvanised tubes is limited? Or is it difficult to replace GP pipes?
  4. Higher margins are to some extent is due to less amount of zinc utilisation. What is the quantity/value of zinc required per ton of tricoat tubes v/s GP pipes.
  5. Can they pass on increase in raw material cost(predominantly steel) to customers. Even APL tubes couldn’t do it effectively is last few quarters.
  6. Better margins may be due to fact that they are going to use APL tubes distributors? What will be the expenses if they have to pay for it or end up using separate distributors?
  7. What will be the logistic costs if they have to supply all over India from single plant location?
  8. At the end its commodity conversion business. Does it deserve valuation of 530 Cr market cap.

Disclosure: tracking position.

Posts: 11

Participants: 7

Read full topic

Amudha's portfolio

$
0
0

@Amudha wrote:

Hi,
Im a homemaker and I started investing towards the end of 2013.
The main things that I look for while selecting companies are the opportunity size and management competency. The checks that I do to assess management competency are to see if the mgmt. has followed up on their plans from the past annual reports,profitability ratios of the company and basic checks about promoters from publicly available information.
I don’t prefer to churn my portfolio a lot. My top 6 holdings except Natco have been holding for last 4-5 yrs averaging up on some occasions.

Last october, I did some clean up, and now this is how my portfolio looks like.

Company Average buy price %of portfolio

HDFC Bank 810 20%
Tata Elxsi 307 13%
Astral Polytechnik 379 9%
Natco Pharma 868 8%
Godrej cons. prod 460 8%
Jyothy labs 94 7%
Gruh Finance 142 7%
IDFC First bank 41 5%
Reliance 488 5%
Deepak Nitrite 240 3%
Repco Home fin 497 3%

Other than these I have 1-2% tracking positions in Mayur, CCL prod and vinati organics and remaining in cash

Rationale for investment:

HDFC Bank- most reliable and safe in banking industry and has still a long runway for about 20% growth

Tata Elxsi - Operates in niche area and huge opportunity size. Negatives are that merger with TCS is a possibility and dependence on JLR

Astral - High growth, they have been growing profits at 20% when the real estate sector is down. My expectation is that things will get even better for them when real estate picksup.

Natcopharma - This is one company that has been dragging down my portfolio’s performance. But I have faith in the management and Im willing to hold it for another year to see where it goes.

Godrej consumer products - very innovative company with high appetite for growth. Their Indian business is doing really well. Their international business is not doing so well in latin america and Africa. Everything depends on how quickly they can turnaround and become profitable in these geographies.

Jyothy Labs:This is one company that understands the indian consumer mindset very well. Their products Ujala, Exo and Pril are doing very well against HULs Robin blue, vim etc.
Im betting on them coming up with a few more blockbuster products. They have plans to acquire some regional brands and take it national .

Gruh Finance:
I have been holding this since 2014 and it has been a steady compounder for me. Now the merger with Bandhan Bank came out of blue. Im continuing to hold it since I believe that it is not a bad deal for Gruh finance share holders and Bandhan has good operating metrics.

IDFC Bank.
The only reason Im invested in this bank as of now is my faith in Mr.Vaidyanathan’s leadership.
I strongly believe that he can turn things around at IDFC bank.

Reliance- for adding stability to the portfolio.

Deepak Nitrite - The new phenolics plant is expected to double the revenues and company has plans to produce downsteam products from phenol and Acetone.

My risk taking ability is moderate. Portfolio is down about 18% from the highs of mid 2018, but im not too much worried about it. I’m expecting 20-25% returns from this portfolio.

I request feedback from seniors and fellow Value Pickers on my portfolio

Posts: 12

Participants: 6

Read full topic

Divyanshu's Portfolio

$
0
0

@Divyanshu_Bagga wrote:

I finally managed to convince my father to move a part of his real-estate investments to equity. So I am trying to build a portfolio for him which has low volatility and yet gives decent return (inflation + 7-10%)

The criteria for selecting stocks in the portfolio is

  1. There should be huge opportunity size available to business for growth.

  2. It must have sustainable competitive advantage to ensure that large opportunity is captured in its bottomline.

  3. Management integrity is not questionable.

Such a stock, if well discovered, will trade at high earning multiple, carrying only valuation risk, as there is no management quality or business quality risk. Hence we plan to buy the stocks in the portfolio in a staggered manner, investing a fixed amount every month.

Following is the portfolio:

Stock Weightage
Dmart 10%
Bandhan Bank 10%
Page Industries 10%
Asian Paints 10%
Pidilite 10%
3M India 10%
Info edge 10%
Hdfc bank 10%
Nestle 5%
HUL 5%
Drreddy 5%
Bajaj finance 5%

I intend to hold all stock until

  • Its competitive advantage starts eroding away.

  • I find a better opportunity

Hence I am actively looking for pointers which suggests the competitive moat may be weakening in my stock picks or suggestions to replace my pick with idea having better prospects will lesser risk.

Posts: 61

Participants: 13

Read full topic

Hindustan Organic Chemical Limited

$
0
0

@chaitanyak wrote:

HINDUSTAN ORGANIC CHEMICALS LIMITED(HOCL) is a PSU incorporated in 1960 under the Ministry of Chemicals & Fertilisers. It is the second largest producer of Phenol and Acetone in India.

It has two manufacturing units, viz. Rasayani Unit (total 14 plants for different chemical products located in this unit), which manufactures Aniline, Nitro-benzene, Formaldehyde and Nitrogen oxide. The Kochi Unit was set up for producing 40,000 TPA of Phenol , 24640 TPA of Acetone and Hydrogen Peroxide(5225 TPA later expanded to 14000 MTPA using de-bottlenecking) in 1987. one subsidiary unit, viz. Hindustan Fluorocarbons Limited, a plastic chemical and is situated in Medak District of Telangana.

Product portfolio : Nitrobenzene, Hydrogen, Aniline, Sulphuric acid, Oleums, Formaldehyde, Nitrotoluenes, Concentrated Nitric Acid, Nitrogen tetroxide, Caustic soda ,Lye, Chlorine, Phenol, Acetone and Hydrogen peroxide. Last 3 are from Kochi plant rest all from rasayani plant.

I am not going to discuss Rasayani plant as it was shutdown and will be liquidated soon.

Kochi Plant product details:
PHENOL is used in the manufacture of preservatives, disinfectants, lubricating oils, herbicides, insecticides, pharmaceuticals, etc. Hocl and SI(unlisted) is only producing this in india. India requires about 2.5 lakh tonnes to 3 lakh tonnes of phenol. Out of that the domestic market is producing only 80,000 tonnes. The balance 2.2 lakh tonnes is imported. Competitor (might be Deepak Fert) is producing another 40,000 tonnes. So, 80,000 tonnes is the installed capacity in India and the balance is imported. This data is according to 2015 stats, now the import quantum is much bigger. Last year Hocl manufactured 10609 TPA, which is very less mainly because of working capital issues, plant were shut down for several days.

ACETONE is another product with wide usage as a solvent for Cellulose Acetate, Nitrocellulose, Celluloid, Cellulose Ether, chlorinated Rubber, various resins, fats and oils and an absorbent for Acetylene Gas. The Indian acetone market, currently estimated at 180.5 thousand MT, is expected to grow at a rate of around 11.0 percent till 2022. Currently india imports more than 80 percent of acetone consumption in India. Indian companies manufactured 25000 metric tons, HOCL manufactured 14000 of the same.

HYDROGEN PEROXIDE is an eco-friendly chemical with wide application in Paper and Textile Industries for Bleaching purpose as a substitute for hazardous Chlorine. It is also used in Electronic and metallurgical industries, Effluent Treatment Plants, Sewage Treatment and for removal of Toxic Pollutants from Industrial Gas Streams. I don’t have the india production data for this but HOCL produced 9000 TPA in FY 18.

Subsidiary Unit Hindustan Flouro Carbons Limited (A Subsidiary Company of HOCL),Telangana makes PTFE. Hocl plans to divest the stake in this company and bidding process is already completed for the same.

What happened in the past (Bad times):
HOCL was a blue chip Company till mid 1990’s and all plants are making good profits. But suffered heavily due to steep fall (50-60%) in international prices of its main products, e.g., Phenol, Acetone and Aniline during 1999 other than changes in customs duty resulted in loss of revenue to the Company that adversely affected its profitability. The Company could not implement plans and projects to cope with economic liberalization and globalization, ex: The projects Caustic Soda (20,000 MTPA), PU Systems, Jawaharlal Nehru Port Trust (JNPT) Tank Terminal became NPA assets for several reasons. The Company had borrowings (Bonds) to the extent of ₹250 crore for the said projects, with annual interest burden of ₹31 crore.

HOCL rasayani plant used manufacture 14 products with 2300 permanent employees. Most of the capacities of rasayani plant is less than 10000 TPA without any economies of scale. During no anti dumping duty phase, HOCL unable to compete with cheap imports because of high crude prices resulting losses. Later company issues commercial paper with 250 cr for Caustic soda plant set-up by agreeing power cost @4rs with Maha govt. But when the project completed power price was changed to 8rs halting the project even before start.

HOCL has stopped 14 plants operation in Rasayani because of commercial viability and working capital issues. Subsequently 2300 employees wage cost on govt revised guidelines is simply mounting the debt pile. Bleeding with continued losses, HOCL was registered for BIFR as a sick company in January 2005. Subsequently, a rehabilitation proposal was approved and implemented by the Government during 2006-07. As a result, the company made a profit of Rs. 17.04 crore during 2006-07 and Rs 13.61 crore in 2007-08 and came out of the BIFR in May, 2008. As per rehabilitation package terms, HOCL has been given time for redemption from 2011 starting 20% for five years for total 270 cr.

However since 2011, anti dumping duty is expired from JAPAN, EU , USA and Taiwan and the process of re imposition of ADD is delayed by 2 years and this resulted once again mounting losses for HOCL, particularly Rasayani plant is idle with huge employee base. Moreover the rehabilitation package is 70% used for employee VRS and other non operating expenses such as paying the debts and not on any other aspect to strengthen its functioning. This resulted HOCL once again running behind working capital issues. Govt had postponed redemption action to 2017 with 25% redeem every year starting 2017 in four yearly instalments. HOCL by 2016 , company had accumulated losses of 1100cr other than 270cr govt revival package. With accumulated losses resulting in erosion of net worth of the Company, HOCL was again referred to BIFR for the second time in 2014, since then it never recovered.

HOCL Kochi plant is always generating profit, but this is moved to rasayani wage expenses. This inturn creating working capital issues for Kochi plant as well.
Ex: HOCL Kochi unit sourcing its main raw material LPG and Benzene from BPCL which has an adjacent refinery (KRL). The supply of raw material is through pipeline. Since HOCL could not clear the dues of raw material suppliers which had accumulated to the extent of Rs. 100 crore resulting in BPCL stopping the supply of raw material to Kochi unit.
HOCL did the below actions to overcome the crisis
• Sale of surplus obsolete unserviceable Plant and Machinery at Rasayani. The Company has realized ₹40 crore over the years by way of sale of old plant and machineries.
• An amount of ₹72 crore can be realized as upfront lease premium from CONCOR towards 60 Acre of land proposed to be leased at Rasayani.
• Similar negotiations with M/s HPCL and BPCL for leasing of land.
• Scouted for 1million ton aniline project setup with gujarat state PSU majors.
• Trying to sell unused land to create working capital liquidity issues.
Being the PSU where govt approval required for all decisions simply didn’t work in the short term for handling the crisis.

So the problems of high debt, idle assets, technical up-gradation failures, working capital issues, laziness in decision making, failing in taking protective measures of govt company , all in all ground level issues faced by distressed PSU is happened.

Recent Updates in right direction:
• HOCL Rasayani plant is 1000+ acres in size with plants, accommodation occupying 300+ acres. Finally govt approved the land sale last year to BPCL. BPCL bought 442 acres from HOCL at a rate of 1.4cr per acre resulting 600cr, company received 350cr and balance amount will be settled this year.
• Similarly HOCL manufactures N2O4 rocket propellant exclusively for ISRO, considering this ISRO bought corresponding unit for 30cr and govt gave bridge loan of 300 cr to clear all bond paper redemption.
• HOCL board approved another 240 acre land sale to BPCL in march, this will generate another 400cr.
• Similarly company holds 8 acre land in Panvel, selling process through NBCC is in progress.
• Rasayani plant already shut down and all the employees were taken VRS adoption, resulting no further cash flow to this plant.

Totally these 1400cr will help HOCL coming out from all the short, long term liabilities and running the Kochi unit normally. Kochi unit generates 5cr profit per month when it run successfully during 2015. Kochi plant is running normally in the current year, this is started generating operating profits after several years.

Next Planned actions:
• Streamlining Kochi operations, SAP ERP implementation is done for the same.
• Up gradation on Kochi plant with the below priorities.
• Kochi plants are producing phenol and acetone and they are money earning plants. These plants are not having the latest technology. Change of catalyst from Solid Phosphoric Acid (SPA) to Zeolite technology catalyst involving a capital expenditure of Rs. 60 crore , by which the capacity of the plant can be increased from the present 54000 MTPA to 90000 MTPA and the production cost can be reduced by 5%.
• It is also proposed to increase the capacity of the existing Phenol plant from 40000 MTPA to 68000 MTPA by debottlenecking / revamping with estimated of Rs. 200 crore.

Currently the main chemicals Phenol, Acetone and Hydrogen Peroxide all are having only 20-30% domestic production, india is depending on import of all these.


Ref: https://www.statista.com/statistics/727799/india-phenol-production-volume/

All these 3 product projected growths are anywhere between 6-10%

Demand Drivers for company products
image

Currently no new projects are planned and any new project for 100KTPA acetone will be 600 crore with a breakeven period of 4.5 years.

Under these circumstances company is in a nice spot w.r.to opportunities. Atleast the recent actions initiated by mgmt giving hope of company moving in a right direction.

Financials
image
Observations:
For H1 company reported sales of 342cr vs 97cr last year registering 3X growth implying no dearth of demand.
Net profit of 66cr vs net loss of 82crores, other income played a major role in this. But good to see the operational profit also coming as 20crores.
EPS of 10rs vs -12rs for the half year ended with Sep,2018.

Positives:

  1. Anti dumping duty on all the products, protecting the company. Most of the countries Taiwan, EU, Middle-east, Japan others till 2020 October,with Duty amount ranging between 80$-250$ per MT.
  2. Working capital issues are cleared, running the KOCHI plant normally for 6 months continuesly the first time in last 6-7 years.
  3. Major working capital issues are resolved and concrete plans of kochi plant upgradation.
  4. Only 2 companies in acetone and Phenol, less than 5 companies operating in Hydrogen peroxide providing no headroom for much competition. No new projects atleast for next 3 years coming up in india leaving demand to propel as expected.

Negatives:

  1. PSU tag and past history of referring to BIFR state.
  2. High crude prices will dent margins
  3. Regulatory changes w.r.to Anti Dumping Duty might spoil the show, currently the ADD exists for 2020 on

Disclosure:
Currently stock price @34rs with a market cap of 225cr. I am considering it as a turnaround story with the changes and i am invested in this company.

Posts: 22

Participants: 13

Read full topic

Venkat's Portfolio - 2022

$
0
0

@Venkat.Anna wrote:

Dear Forum Members,

I have been investing in stock market since 2009 onward’s after the subprime crisis. I started earning/saving only after 2008 time. During the crisis I was working for a Wall Street Bank in US when daily I used to hear that some or the other company in US is bankrupt. Luckily, the department I was in was the one used to block all these bankrupt companies, so my job was saved. Bank also got saved as it was part of the Big Four(Too big to fail).

My earlier Multibaggers were Sterlite Technologies (10X), Arvind Mills(10X), IOCL(5X) & GIC Housing Finance(11X).
Failures - NHPC, Bharati Shipyard, Adani Power, Mphasis & Aban offshore.
I sold all my shares in Jan 2018 fearing recession in India as the economy was slowing.

Here is my learning, Government decision plays a big role in stock market investing, so choose business where the government is favorable towards the sectors. Also, government will open the purse when there is a big turmoil in the economy/GDP growth(Current Situation). Government also favors businesses or incentivize the business where there is huge demand. Need to monitor those sectors closely.

Here is my list of Stocks with equal allocations of 10% each which I started adding from October, 2018. I am sitting on 80% cash waiting to be deployed before the general elections.

Nitin Spinners - It is into Cotton Yarn manufacturing. Very good management, CEO is a Chartered Accountant with all India Rank, first generation enterpreneur with long run way. Company has been a turnaround story after initial mistakes with forex, NPAs etc. It has since then made a turn around & made good capacity additions recently. Next capex is planned for Rs. 600 for production of fabric but yet to start. Good Inventory Management & debt Reduction. Expected Return - 3X in 5 years.

CAN FIN Homes - Retail HFC, Good ROE, Risk of default is less. Branch expansion is good, predominantly south India based HFC. Future growth is more in South India as the majority of the Tech companies(Young Population), lesser defaults. Company is growing at a decent pace. Expected Return - 3X in 5 years.

Yes Bank - Company is really good at marketing, CASA is GOOD, CEO has a good global experience. May be having a bad time handling the Government. ROE is comparable to HDFC bank, lot is being invested in technology which is the back bone for any bank. - 5X in 5 years.

Rain Industries - Company has a good R&D & Capacity to grow, lot is being invested for future materials used in EV. Company is cyclical with crude as the main raw material. We are in the down cycle for crude as there is over capacity world wide & emergence of EVs. - 5X in 5 years.

Mirza International - Consumer discretionary theme very good leather products. Company has good products, RED TAPE brand. - 5X in 5 Years.

ABFRL - Consumer discretionary theme, Company has good set of brands for all category of peoples, Retail Stores with Pantaloon. Quality of the products are really good - Peter England, Van Heusen, Louis Phillip, shoes, belts etc. - 3X in 5 Years, 10X in 10 Years. Long run way.

LT Foods - Consumer Discretionary theme, more people will eat Basmati Rice. Company has good products in packaged foods. - 5x in 5 years.

Deepak Nitrite - Good Management with vast experience in Chemical Industry. Capex completed recently. Long runway with Phenol & Acetone plants. - 3X in 5 Years.

Also, tracking GIC housing finance, HDFC life, ICICI Securities, Birla Cable, Bodal Chemicals, Biocon, Persistent Systems.

Kindly, provide your views on my portfolio. I have learnt lot from the fellow forum members. During my initial days, there was no forum like this to discuss on stock markets. Thanks to ValuePickr team for such a superb platform. Hope this will help n number of investors to create wealth in India as most of the shady companies have been cleaned up in the last 3 years.

Posts: 35

Participants: 16

Read full topic

Viewing all 602 articles
Browse latest View live